
 JOURNAL TOOLS
Use of different statistical approaches in prediction of metabolizable energy of diets for broilers


Studentski Trg 12 - 16, 11000 Belgrade, Serbia
2University of Novi Sad, Institute of Food Technology,
Bulevar cara Lazara 1, 21000 Novi Sad, Serbia
ABSTRACT
Energy value of diets has importance for feed producers and farmers. Since methods for in vivo metabolizable energy (ME) determination require the use of live animals they can be considered as most accurate. On the other hand, these methods are often time and cost consuming (Elkin, 1987; Mohamed et al., 1984; Palić and Leeuw, 2009; Pojić et al., 2008). There has been a considerable interest to find accurate methods for ME prediction, which will be also rapid and inexpensive (Robbins and Firman, 2005; Zhang et al., 1994).
Recently, mathematical modelling has been increasingly used for the study of the given systems. Developed empirical models show a reasonable fit to experimental data and successfully predict ME (Perai et al., 2010). Nonlinear models are found to be more suitable for real process simulation. First order polynomial (FOP), using Response Surface Methodology (RSM) and Artificial Neural Network (ANN) models have gained momentum for modelling and control of processes (Khuri and Mukhopadhyay, 2010; Priddy and Keller, 2005).
ANN models are recognized as a good modelling tool since they provide the empirical solution to the problems from a set of experimental data, and are capable of handling complex systems with nonlinearities and interactions between decision variables (Almeida, 2002). The specific objective of this study was to investigate the effect of EDOM and values of proximate chemical analysis on nitrogen corrected true metabolisable energy (TMEn) content of diets for broilers. The performance of ANN was compared with the performance of FOP, as well as to experimental data, in order to develop rapid and accurate method for prediction of TMEn.
MATERIAL AND METHODS
Feed and assays
Twenty one diets for broilers were used in the study. Proximate chemical composition of the diets was determined according to AOAC standard methods (AOAC, 2000). Estimation of the enzymatic digestibility of organic matter (EDOM) was performed by use of modified method of Boisen and Fernandez (1997). In vivo TMEn content of the diets was determined using the assay described by McNab and Blair (1988).
Principal Component Analysis (PCA)
Principal Component Analysis (PCA) is a mathematical procedure used as a central tool in exploratory data analysis (Brlek et al., 2013). It is a multivariate technique in which the data are transformed into orthogonal components that are linear combinations of the original variables. PCA is performed by Eigenvalue decomposition of a data correlation matrix (Abdi and Williams, 2010). This transformation is defined in such a way that the first component has the largest possible variance. This analysis is used to achieve maximum separation among clusters of parameters (Pezo et al., 2013). This approach, evidencing spatial relationship between processing parameters, enabled a differentiation between the different samples.
First order polynomial (FOP) model
According to general recommendations, prior to ANN modelling, analysis of variance (ANOVA) was performed, in order to check the significant effect of the input variables over the output, as well as to justify the later use of ANN model by coefficient of determination (r2). Analysis and mathematical modelling was performed using StatSoft Statistica 10.0 software (Statistica, 2010).
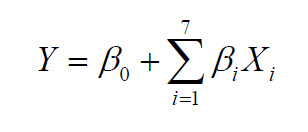
The FOP model was used for estimation of the main effect of the process variables on responses. The independent variables used for modelling were dry matter (DM), crude protein (CP), crude fibre (CFi), crude fat (CFa), crude ash (CA), organic matter (OM) and enzymatic digestible organic matter (EDOM), while TMEn was response variable. FOP model was fitted to data collected by experimental measurements:
 (1)
(1)
where: β0 and βi are constant regression coefficients, Y is response variable, while Xi are independent variables. The significant terms in the model were found using ANOVA for each dependent variable.
Artificial Neural Network (ANN) modelling
The database for ANN was randomly divided to: training data (60%), cross-validation (20%) and testing data (20%). The cross-validation data set was used to test the performance of the network, while training was in progress as an indicator of the level of generalization and the time at which the network has begun to over-train. Testing data set was used to examine the network generalization capability.
To improve the behaviour of the ANN, both input and output data were normalized. In order to obtain good network behaviour, it is necessary to make a trial and error procedure and also to choose the number of hidden layers, and the number of neurons in hidden layer(s). A multi-layer perceptron model (MLP) consisted of three layers (input, hidden and output). Such a model has been proven as a quite capable of approximating nonlinear functions (Hu and Weng, 2009) giving the reason for choosing it in this study. In this work the number of hidden neurons for optimal network was ten. Broyden–Fletcher–Goldfarb–Shanno (BFGS) algorithm was used for ANN modelling.
After defining the architecture of ANN, the training step was initiated. The training process was repeated several times in order to get the best performance of the ANN, due to a high degree of variability of parameters. It was accepted that the successful training was achieved when learning and cross-validation curves (Sum of Squares vs. training cycles) approached zero. Testing was carried out with the best weights stored during the training step. Coefficient of determination (r2) and SOS were used as parameters to check the performance (i.e. the accuracy) of the obtained ANNs.
After the best behaved ANN was chosen, the model was implemented using an algebraic system of equations to predict TMEn content of studied diets.
The goodness of fit
The goodness of fit for developed models (FOP and ANN) were evaluated using the coefficient of determination (r2), the mean relative percent error (P), the root mean square error (RMSE) and the reduced chi-square (χ2). The higher the values of r2 and the lower the values of P, RMSE and χ2, the better is the goodness of the fit. These parameters can be calculated as follows:
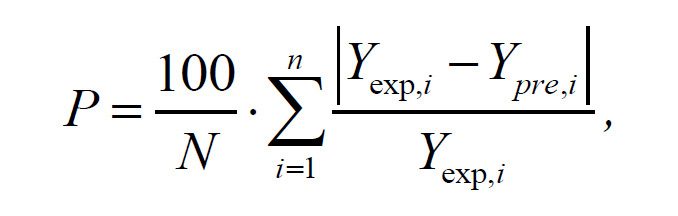
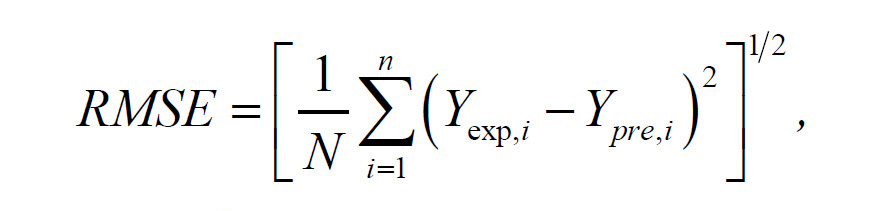
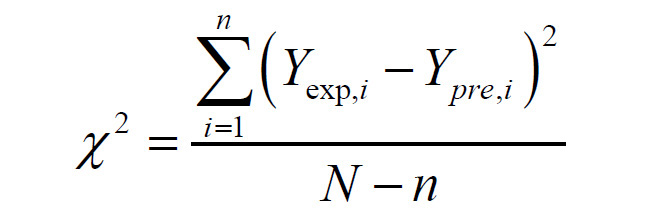
where Yexp,i is the ith experimentally observed response Y, Ypre,i is the ith predicted Y, N is the number of observations and n is the number of constants.
Sensitivity analysis
Sensitivity analysis is a sophisticated technique which is necessary to use for studying the effects of observed input variables and also the uncertainties in obtained models and general network behaviour. Neural networks were tested using sensitivity analysis, to determine whether and under what circumstances obtained model might result in an ill-conditioned system (Taylor, 2006). On the basis of developed ANN model, sensitivity analysis was performed in order to more precisely define the influence of processing variables on the observed outputs. The infinitesimal amount (+0.0001%) has been added to each input variable, in 10 equally spaced individual points encompassed by the minimum and maximum of the train data. These signals were normally distributed with a constant intensity and frequency. It was used to test the model sensitivity and measurement errors.
Results and Discussion
Results of proximate chemical analysis, EDOM and TMEn content of broiler diets are presented using descriptive statistics in Table 1. DM, CP, CFa, CFi, CA, OM, EDOM, and TMEn varied significantly, implying that fitting of the experimental data can be performed using FOP and ANN modelling.
|
DM (%) |
CP* (%) |
CFi* (%) |
CFa* (%) |
CA* (%) |
OM* (%) |
TMEn (MJ/Kg DM) |
EDOM (%) |
|
|
Average |
88.42 |
23.53 |
3.36 |
6.68 |
6.18 |
93.82 |
15.58 |
80.52 |
|
SD |
1.06 |
3.09 |
1.73 |
3.43 |
1.55 |
1.55 |
1.01 |
3.42 |
|
Min. |
85.30 |
16.63 |
1.90 |
2.79 |
3.81 |
88.61 |
12.60 |
71.50 |
|
Max. |
89.85 |
27.37 |
8.87 |
14.88 |
11.39 |
96.19 |
17.18 |
86.76 |
|
Var. |
1.13 |
9.55 |
3.00 |
11.80 |
2.41 |
2.41 |
1.02 |
11.71 |
*Results are expressed on dry matter basis; SD - Standard deviation; Min. – Minimum; Max. – Maximum; Var. ‑ Variance
Principal component analysis (PCA)
Preliminary performed calculation for estimation of effects, using RSM of experimental data, showed that only EDOM, CFa, CFi, and CA variables influenced TMEn at statistically significant level (p<0.05). Therefore DM, CP and OM were excluded from further calculation.
The PCA applied to the given data set has shown a differentiation between the samples according to used process parameters, and it was used as a tool in exploratory data analysis to characterize and differentiate neural network input parameters (Figure 1). As it can be seen, there is a neat separation of the observed samples according to used assays. Quality results show that the first two principal components, accounting for 81.53% of the total variability for TMEn, can be considered sufficient for data representation. CFi content, CA, TMEn and EDOM had been more influential for the first factor coordinate calculation (accounting 25.5, 29.9, 22.9 and 20.1% contribution, respectively), while CFa content had been more influential for the second factor coordinate calculation (67.3%, respectively).
PCA (Figure 1) showed quite good discrimination between samples. Starter samples (1 and 2) are grouped at the centre of the graph, while LP and HP finisher samples (3 and 4) are grouped at the lower side of the graph (with increased CFa). Finisher and grower feed samples (5 and 6) are located on the right side of the graph (with increased CFi and CA). Starter samples (7-12) are located on the left side of the graph, with increased EDOM and TMEn. Grower samples (13-16) are located in the central area of the graph. Starter samples containing by-products of biodiesel production (17-21) are located at the top of graph, with the lowest values of CFa, CFi, CA, TMEn and EDOM.
Position of proximate chemical analysis parameters, EDOM and TMEn is showing that EDOM and TMEn are positively correlated, while CFi and TMEn are negatively correlated, meaning that when CFi of the diet is decreasing and EDOM is increasing, TMEn will increase.
 Figure 1. Biplot graph of broiler diets with the results of proximate analysis, EDOM and TMEn content
Figure 1.Biplot graph of broiler diets with the results of proximate analysis, EDOM and TMEn content
Analysis of variance and FOP model
Analysis of variance (ANOVA) was conducted for obtained FOP model, and output were tested against the impact of input variables (Table 2). Analysis revealed that linear terms considerably influenced forming of FOP model for TMEn calculation.
According to ANOVA results, TMEn was mostly affected by CA, which was statistically significant at p<0.001 level. CFa was also very influential, at p<0.001 level as well. CFi and EDOM were also very influential, statistically significant at p<0.05 level. DM, CP and OM were excluded from this calculation, as explained before. The coefficient of determination (r2) for FOP model was rather low (0.859), which leads to the conclusion that ANN model developing would improve the validity of the model.
|
Factor |
df |
SS |
F |
p |
|
CFi |
1 |
1.30* |
7.25 |
0.02 |
|
CFa |
1 |
5.88+ |
32.70 |
<0.001 |
|
CA |
1 |
9.70+ |
54.00 |
<0.001 |
|
EDOM |
1 |
0.84* |
4.67 |
0.46 |
|
Error |
16 |
2.88 |
||
|
r2 |
0.859 |
+Significant at p<0.001 level, *Significant at p<0.05 level, 95% confidence limit; df - Degrees of freedom, SS - Sum of squares, F - F-test value
The residual variance, marked as ‘Error’ in Table 2, presents the model disagreement with the experimental values i.e. contributions of terms that are not described in the FOP model. The residual analysis showed that the mean of residuals was equal to zero, and the standard deviation was 0.379 (with minimum of -0.527 and the maximum of 0.902). These results showed a good approximation to a normal distribution around zero with a probability of 95% (2×SD), which means a good generalization ability of the developed model for the range of observed experimental values (the skewness parameter showed minimal deviations from normal distribution, 0.546, while the Kurtoisis parameter showed almost negligible difference in "peakedness" compared to normal distribution, -0.254). Developed model showed statistically insignificant deviation from the experimental values of the model, which confirmed its suitability. Evaluated values of coefficient of determination (0.859), the mean relative percent error (2.072), the root mean square error (0.370) and the reduced chi-square (0.169) confirmed that obtained FOP model was statistically significant and in agreement with experimental results.
Neurons in the ANN hidden layer
All variables considered in the RSM, were also used for the ANN modelling. Determination of the appropriate number of hidden layers and number of hidden neurons in each layer is one of the most critical tasks in ANN design. The number of neurons in a hidden layer depends on the complexity of the relationship between inputs and outputs. As this relationship becomes more complex, more neurons should be added (Ćurčić et al., 2014).
The optimum number of hidden neurons was chosen upon minimizing the difference between predicted ANN values and desired outputs, using Sum of Squares (SOS) during testing as performance indicator. Used multi-layer perceptron models (MLPs) were marked according to StatSoft Statistica's notation. MLP was followed by number of inputs, number of neurons in the hidden layer, and the number of outputs. According to ANN performance (Table 3), it was noticed that the optimal number of neurons in the hidden layer for TMEn calculation was 9 (network MLP 4-9-1), when obtaining high values of r2 (0.992 for ANN during training period, compared to 0.859 for FOP model) and low values of SOS.
|
Network name |
MLP 4-10-1 |
|
|
Training |
Testing |
Validation |
|
r2=0.992 |
r2=0.894 |
r2=0.999 |
|
Training error |
Testing error |
Validation error |
|
0.0005 |
0.0038 |
0.0012 |
|
Training algorithm: BFGS 30 |
||
|
Error function: SOS |
||
|
Hidden activation: Exponential |
||
|
Output activation: Tanh |
||
Simulation of the ANN
Optimal network, used for prediction of TMEn was able to predict reasonably well the output for a broad range of the process variables (coefficients of determination reached 0.992 for TMEn prediction). The predicted values were very close to the experimental (target) values in most cases, in terms of r2 value for both FOP and ANN models.
It can be seen that the r2 value for ANN model is higher than that associated with the FOP model. This is in line with findings of Perai et al. (2010) who compared different statistical approaches for prediction of ME of meat and bone meal. Generally, ANN model is more complex (55 weights-biases for ME calculation) than FOP, and it has performed better fitting of experimental data due to the high nonlinearity of the developed system (Karlović et al., 2013; Chattopadhyaya and Rangarajana, 2014).
 Figure 2. .Comparison of experimentally obtained TMEn with ANN and FOP predicted values
The mean and the standard deviation of residuals have also been analysed. The mean of residuals for ANN model was equal to 0.014, and the standard deviation was 0.110 (with minimum of -0.586 and the maximum of 0.701). The skewness parameter showed minimal deviations from normal distribution (-0.050), while the Kurtoisis parameter showed almost negligible difference in "peakedness" compared to normal distribution (0.439). Evaluated values of coefficient of determination (0.859), the mean relative percent error (2.072), the root mean square error (0.370) and the reduced chi-square (0.169) are confirming that obtained FOP model was statistically significant and in agreement with experimental results.
Sensitivity analysis
In order to assess the effect of changes in the outputs due to the changes in the inputs, a sensitivity analysis was performed. The greater effect observed in the output implies that greater sensitivity is presented with respect to the input (Pezo et al., 2013). Sensitivity analysis has been performed to test an infinitesimal change in an input value in 10 equally spaced individual points, ranged by the minimum and maximum of the observed assay, in order to explore the changes in observed outputs. It is also used to test the model sensitivity and measurement errors.
 Figure 3. Sensitivity analysis - the influence of the input over the output variables
Figure 3.Sensitivity analysis - the influence of the input over the output variables
The influence of the input over the output variables, i.e. calculated changes of output variables for infinitesimal changes in input variables, is shown on Figure 3. Obtained values corresponded to the level of experimental errors, and also showed the CFa, CFi, CA and EDOM influence on TMEn.
Sensitivity analysis is used to show the influence of the inputs, but it also shows the importance of an input variable at a given point in the input space (Saltelli and Annoni, 2010). As it can be seen on Figure 3, TMEn was affected more strongly by the infinitesimal changes of CFa, CFi, CA, and EDOM at the extreme values of the input range. These findings are in accordance with PCA and ANOVA analysis, as well as with experimental measurements.
Conclusions
This paper presented different statistical approaches for prediction of in vivo TMEn content in complete diets for broilers using the results of proximate chemical analysis and EDOM. FOP and ANN-based models were developed for prediction of TMEn for a wide range of input variables. Both models are easy to implement and could be effectively used for predictive purposes, modelling and optimization. As compared to RSM, ANN model yielded a better fit of experimental data. Taking into account that a considerable amount and wide variety of data were used in the present work to obtain the ANN model, and considering that the model turned out to yield a sufficiently good representation of the experimental results, it can be expected that it will be useful in practice.
АCKNOWLEDGEMENTS
This paper is a result of the research within the project III 46012 “Investigation of contemporary biotechnological processes in animal feed production, aimed at increasing food competitiveness, quality, and safety”, financed by the Ministry of Science and Technological Development, Republic of Serbia.