ABSTRACT
Abstract
The establishment of independent measuring and technical infrastructure for cereal quality evaluation worldwide enables keeping cereal analysis a step ahead of evolving industry demands. The near infrared instruments make the basis of this unique infrastructure, while clearly defined and proven quality assurance procedures divided between various measurement services ensure obtaining reliable, traceable and comparable results. Although it is a common practise worldwide, in Serbia there are certain constraints in applications of this remarkable technique. The aim of this paper is to show the way of ensuring traceability on the level of a national technical and measuring infrastructure for the crops quality control.
INTRODUCTION
The science of measurement has the great importance in everyday life worldwide. International trade, industrial production, medicine, environmental protection and science are highly dependable on accurate and precise measurements producing reliable, traceable and comparable results. These requirements comprise the existence of certain analytical measurement infrastructure either on national, regional or international level through which metrology and accreditation issues are covered (Buzoianu, & Aboul-Enein, 1997). A measurement infrastructure is defined as a collection of various measurement services (testing, calibration and reference laboratories) and the communication between these services (Taylor et al., 2004).
The increasing interest in prediction of end-use potential of the grain has initiated the establishment of unique measuring infrastructures for the determination of cereal quality all over the world. The beginning step was taken in 1975, when Canadian Grain Commission changed their massive wheat protein-marketing system from Kjeldahl to the method based on nearinfrared spectroscopy (NIRS method). This decision has drawn attention to an application of a rapid, safe, reliable, and inexpensive method for cereal composition analysis for commercial purposes. Due to the fact that traditional methods of crop quality testing are timecon-suming and laborious, and are neither applicable nor effective in supervising and regulating international trade, NIRS technique has enabled a radical new approach to qualifying raw materials and finished products in trade. Together with the introduction of regression modelling using nonlinear artificial neural network (ANN) in the 90’s the NIRS networks involving several thousands instruments have been established throughout Europe, North America and Australia (Büchman et al., 2001; Murray, 1996; Williams, 2007). The ANN calibration models combine very large data sets displaying wide diversity with respect to variety, as well as growing and harvest conditions. Due to these characteristics they have constituted global models and have been adopted all over the world.
The aim of this paper is to show how the transparency and traceability in the national measuring system would be ensured for the cereal quality control.
THE NETWORK CONCEPT
Since grain today is traded on a global level, it becomes increasingly important to harmonize the analytical systems used to set the value of the grain (Büchman,& Runfors, 1995). The price of a certain crop in the international trade highly depends on the quality of a harvest and its enduse potential. For example, the wheat quality is determined by several parameters, protein content being one of them. In order to provide independent measurements of required quality which are (internationally) equivalent, the technical infrastructure has been set up worldwide for measurements of proteins in wheat (Majcen, & Taylor, 2004). The basic objective of a grain network is to harmonize all connected instruments in order to provide comparable results that would contribute the avoidance of trade disputes and penalty fees. The key requirement for system to be regulatory complied is its complete definition with established hierarchy. The system comprises of NIRS instruments that are used for the determination of protein, moisture and starch in wheat and barley, for moisture in rye, for oil in rapeseed etc. Also it requires the existence of certain organization following clearly defined tasks and quality assurance procedures. Managing instruments on a network is enabled throughout software specially designed to assist in monitoring performance and management activities (Shenk, & Wasterhaus, 1994). These form of measuring infrastructure for cereal quality determination allows easy supervision and update of the instruments involved, the optimisation of calibration development, the reduction of calibration cost per instrument, insurance of a high degree of analytical reliability, the reduction of instrument-to-instrument variation to a level below the comparable laboratory-to-laboratory variation, and achievement of uniformity of results (Büchman, 1996; Shenk, & Wasterhaus, 1994).
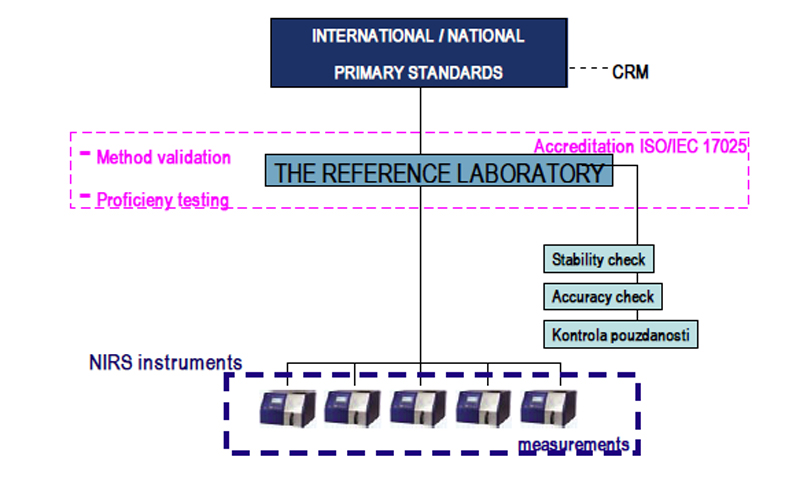
The key role in such a system has the reference laboratorythat analyzes check samples, and monitors the performance of the master instrument. Also, it can be responsible for handling the database maintenance and communication with the instruments. Due to the significance of these tasks, it must be able to demonstrate the international comparability and traceability of the measurements. Figure 1 shows the key elements of traceability chain of the results obtained by NIRS measurements whereas the traceability chain represents the chain of successive measurements of one to another value which ends in the value of the unit. In this case it must be noted that the results of NIRS measurements as well as the results of the reference chemical measurements which is used to check the performance of NIRS method can not be traced to values of SI units, but to the reference materials (Bièvre, 2000).

Fig.1. The key elements of traceability chain of the results obtained by NIRS measurements
THE SITUATION IN SERBIA
Despite the fact that NIRS method for moisture and protein determination has become the official and standard method by the number of international institutions (GIPSA, NTEP, PTB, BEV, French Laboratoire National d´ Essais, Ceský Metrologický Institut, European Council Directive 71/347/EEC, Japanese Ministry of Agriculture, Forestry and Fisheries, etc.), the massive adoption of NIRS technique in Serbia is mainly restrained by the lack of trust in the performance of NIRS method and the lack of knowledge in application and interpretation of NIRS results as well. Furthermore, the potential users in Serbia still do not realize the economic consequences of not testing the crops. Instruments are considered expensive to purchase, whereas the cost of a NIR instrument is not assessed in relation to the value of testing the commodities or materials for the analysis of which the instrument has been purchased (Shenk, & Wasterhaus, 1994; Williams, 2007). Due to that fact, the number of NIRS instruments for a long time has been insufficient for establishment of organized system for cereal quality control.
MATERIALS AND METHODS
Stability check
Stability of the results for protein and moisture content obtained by NIRS measurement was checked by using selected wheat control sample that was scanned on the near infrared instrument Infratec Grain Analyzer 1241 (master unit) each day during the period of 140 days. To judge whether the obtained results were in control, X charts were used (Hovind et al, 2007; ISO 8258).
Accuracy check
Accuracy of the results for moisture and protein content determination was checked by using the sample set of 15 samples characterized with wide range of this constituent. The NIRS results obtained by the master instrument were compared in regard to the results of the reference wet chemistry method. Statistical analysis included bias, coefficient of correlation and standard error of prediction (SEP).
Reliability check
The NIRS results obtained by 3 available instruments were compared in regard to the results of the Infratec Grain Analyzer 1241 instrument that was considered as a master unit. The reliability of the instruments was checked by using the sample set of 15 wheat samples characterized with wide range of protein and moisture content. Statistical analysis included bias, coefficient of correlation, standard error of prediction (SEP), slope, intercept, and t-test.
RESULTS AND DISCUSSION
Stability check
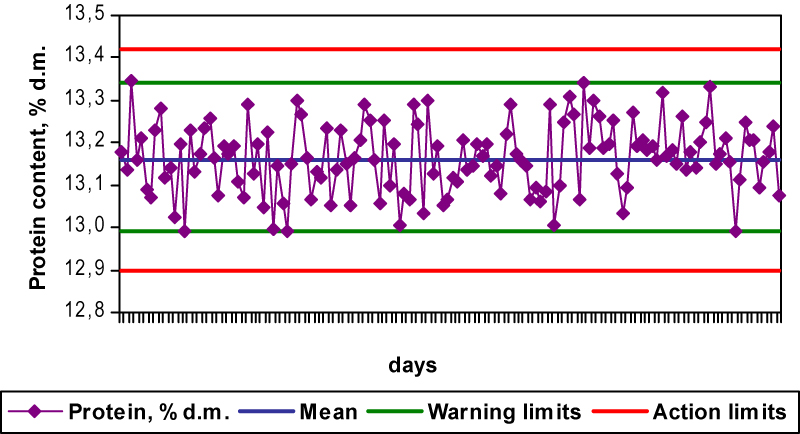
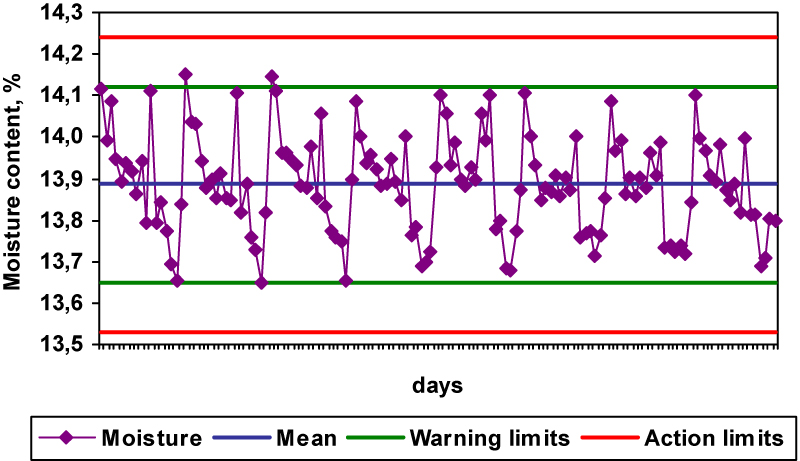
Table 1 shows the daily instrument control data for moisture and protein content. For these two constituents a Shewart (X) chart is plotted (Fig. 2 and Fig. 3). The central line is set up as the mean value of the control values obtained during 140 days, while warning limits are set up at a distance of ± two times the standard deviation from the central line. Futrhermore, the action limits are set up at a distance of ± three times the standard deviation from the central line (Vedder, & Kroes, 1999).
Table 1. X chart control limits for moisture and protein content determination by NIRS
|
|
Moisture,%
|
Protein,%
|
|
Mean
|
13.89
|
13.60
|
|
Standard deviation
|
0.11
|
0.08
|
|
Upper warning limit
|
14.24
|
13.34
|
|
Lower warning limit
|
13.53
|
12.99
|
|
Upper action limit
|
14.12
|
13.42
|
|
Lower action limit
|
13.65
|
12.90
|
The Figures 1 and 2 shows that the control values are within the warning limits indicating that the measurements of moisture and protein content were in control. This procedure is very useful in monitoring the random effects that could cause deviation in NIRS measurements such as instrument factors (noise, wavelength variation, static electricity, aging of components, power supply, etc.), sample factors (sample temperature, interaction between chemical constituents of a sample) and operational factors (sample storage, ambient temperature, sample cell packing and cleanup (Williams, 1987) as well as in prevention inaccurate analysis caused by technical instrument faults.

Fig.2. X control chart for the determination of protein content in wheat by NIRS

Fig.3. X control chart for the determination of moisture content in wheat by NIRS
Accuracy check
Central and dispersion parameters such as the mean, standard deviation, the range, as well as statistical evaluation of accuracy are presented in Table 2. Results for moisture content measured by the reference chemical method ranged from 10.40 to 14.18% while results for moisture content measured by the NIRS method ranged from 10.61 to 14.51%. Protein content measured by the reference chemical method ranged from 10.40 to 16.83% d.m. while results for protein content measured by the NIRS method ranged from 10.42 to 16.62% d.m. being negligible narrower in comparison to the results of the reference values (Table 2). The reference method for moisture content determination gave slightly lower values than NIRS method indicating systematic difference between the reference method results and the predicted NIRS results (bias) of –0.18. Protein content determinated by the reference method was slightly higher than in the case of the NIRS method. indicating negligible systematic difference between reference method results and predicted NIRS results (bias). The main source of discrepancy between values obtained by two methods lies in fact that different subsamples are used to conduct NIRS and reference analysis. as well as in the quantity of sample analyzed. Also. there are differrences between what is measured by NIRS and what is measured by the reference method (Hruschka. 1987; Sørensen. 2002). Hence. NIRS method characteristics were assessed in relation to the reference method applying statistical evaluation that is commonly used as a measure of deviations of NIRS results from the results obtained by the reference method such as standard error of prediction (SEP) bias and coefficient of correlation (Table 2). The coefficients of correlation in both cases were 0.996 indicating very strong dependence of two methods. Standard error of prediction (SEP) was 0.09% for moisture and 0.19% d.m. for protein content indicating a good performance of NIRS method (Table 2).
Table 2. Central and dispersion parameters of determination of moisture and protein content in wheat
|
|
Moisture content.%
|
Protein content.% d.m.
|
|
Method
|
Mean
|
SD
|
Range
|
Mean
|
SD
|
Range
|
|
REF
|
11.37
|
0.92
|
10.40 – 14.18
|
13.21
|
1.92
|
10.40 – 16.83
|
|
NIRS
|
11.55
|
0.95
|
10.61 – 14.51
|
13.18
|
1.97
|
10.42 – 16.62
|
|
Bias
|
-0.18
|
0.03
|
|
Correlation coefficient
|
0.996
|
0.996
|
|
SEL
|
0.09
|
0.15
|
|
SEP
|
0.09
|
0.19
|
Reliability check
The purpose of performing the reliability check is to notice the differences between instruments and to bring them within acceptable limits. This adjustment should be done with a simple bias adjustment. T-test showed that the instruments 1 and 3 gave significantly different results for moisture content in relation to the master unit (Table 3). In spite of the existence of statistically different results. the systematic differences between master results and predicted NIRS results for the instruments 1 and 3 were negligible and far lower than the reproducibility limits for the reference chemical analysis. Moreover. the estimated standard errors of prediction were low. with very high correlation coefficients between master and slave results indicating strong dependence between the two sets of data. Slope values lower than 1.1 indicated a good transferability between instruments (Pojić. & Mastilović. 2006). Obtained results were significantly lower in the comparison of the results reported by Büchmann. (1995) and Büchmann. & Runfors (1996) due to the fact that the number of the instruments they checked were significantly higher.
Table 3. Comparative statistical data for evaluation of the performance of master instruments in relation to the master unit for moisture content determination
Instrument |
SEP.
%
|
Bias.
%
|
Slope
|
Intercept
|
Correlation coefficient
|
t-test
|
|
Master
|
0
|
0
|
1
|
0
|
1
|
|
|
1
|
0.0305
|
0.0706
|
1.0170
|
-0.1244
|
0.9997
|
0.0000*
|
|
2
|
0.0884
|
0.0058
|
1.0692
|
-0.7974
|
0.9985
|
0.8155
|
|
3
|
0.0382
|
0.0401
|
1.0288
|
-0.2917
|
0.9996
|
0.0012*
|
Results marked with asteriks (*) are significantly different from the results obtained by the master
Regarding the protein content determination. calculated t-test showed that there were no significant difference between the slave and master results (Table 4). The bias values for protein content of slave units were low. as well as standard error of prediction. Correlation coefficients between master and slave results were very high. indicating strong dependence between the two sets of data. Slope values around 1.0 indicated a good transferability between instruments.
Table 4. Comparative statistical data for evaluation of the performance of master instruments in relation to the master unit for protein content determination
Instrument |
SEP
|
Bias
|
Slope
|
Intercept
|
Correlation coefficient
|
t-test
|
|
Master
|
0
|
0
|
1
|
0
|
1
|
|
|
1
|
0.1193
|
-0.0336
|
1.0056
|
-0.1101
|
0.9908
|
0.2928
|
|
2
|
0.1321
|
-0.0635
|
1.0195
|
-0.3341
|
0.9980
|
0.1086
|
|
3
|
0.1299
|
-0.0562
|
1.0184
|
-0.3081
|
0.9980
|
0.1162
|
CONCLUSIONS
The present study presented existing approach in ensuring traceability in NIRS measuring infrastructure which could contribute to the establishment of organized system for cereal quality control in Serbia. Despite the fact that presented results showed that determination of moisture and protein content in wheat by NIRS method is reliable and the fact that this method has become the official and standard method by the number of international institutions the massive adoption of NIRS technique in Serbia is mainly restrained by the lack of trust in the performance of NIRS method and the lack of knowledge in application and interpretation of NIRS results as well. Also in Serbia.the economic consequences of not testing the crops are still not realized. Instruments are considered expensive to purchase whereas the cost of a NIR instrument is not assessed in relation to the value of testing the commodities or materials for the analysis of which the instrument has been purchased.
ACKNOWLEDGMENTS
This work was financed by the Ministry of Science and Technological Development Republic of Serbia (Project No. 20139).
Download full article PDF
 DOWNLOAD PDF

 JOURNAL TOOLS


 INSTITUTE