EVALUATION OF TECHNOLOGICAL QUALITY OF WHEAT USING LAB–ON–A–CHIP ELECTROPHORESIS
DOI:
UDK:
JOURNAL No:
Volume 38, Issue 2
PAGES
63-69
KEYWORDS
wheat, electrophoresis, technological quality
Jelena M. Tomić*1, Aleksandra M. Torbica1
1University of Novi Sad, Institute of Food Technology, 21000 Novi Sad,
Bulevar cara Lazara 1, Serbia
Bulevar cara Lazara 1, Serbia
ABSTRACT
Abstract
Technological quality of wheat flour is determined by various chemical, physical and rheological tests where the crucial factor is content and structure of proteins. In this paper, samples of four winter wheat experimental lines were examined. The results of qualitative and quantitative characterization of protein electrophoretic profile of gluten using a Lab-on-a-chip (LoaC) electro-phoresis are shown. Rheological properties of the tested lines were determined by standard flour rheological methods (amylograph, farinograph, extensograph). The values of rheological parameters in conjunction with the electrophoretic results show that the best technological quality have Lines 1 and 3. This conclusion support the assumption that, in terms of quantity and structure, glutenins and gliadins have equal impact on the quality of wheat.
Introduction
Wheat is a widely spread culture whose one of many advantages is that it is adap-table to a wide range of climatic conditions and soil types. Of all the cereals, only wheat flour has the ability to create dough that can retain the gases generated during fermentation and baking, and to form a spongy, porous middle of bread (Shewry et al., 2001, Flæte et al., 2005).
Technological quality of wheat flour is de-termined by the sum of different flour properties which influence the properties of the dough and its behaviour during processing, and ultimately the final pro-duct. It is determined by various chemical, physical and rheological tests where the most commonly used are empirical me-thods as a type of the most dominant, rheological, tests (farinograph, extensor-graph, amilograph and other) (Živančev et al., 2009). The protein content and struc-ture are the most important factors deter-mining the quality of the flour where higher protein content causes higher quality of the final product (Unbehend et al., 2003, Hayta et al., 2001).
Gluten proteins make up 80-85% of the total flour protein and function as wheat storage proteins. They are located in the endosperm of mature grains where they form a continuous matrix in which starch granules are embedded (Goesaert et al., 2005). In contact with water, gluten swells and, as a result, a fine mesh structure is formed due to protein interactions. Con-sequently, dough has features such as extensibility, flexibility, ability to retain gas and others (Žeželj, 2005).
Proteins of gluten complex consist of two fractions, gliadins, soluble in alcohol, and glutenin, insoluble in alcohol but soluble in dilute acids or alkali. Gliadins are mono-meric proteins that are further classified into four groups α-, β-, γ-and ω-gliadins. Gliadins are generally considered to con-tribute to the viscosity and elasticity of glu-ten. Although some authors have asso-ciated specific gliadin alleles with the qua-lity of the final product (bread), it has been agreed that these proteins do not have a direct impact on the wheat quality in terms of dough strength. It is assumed that this is a result of close genetic linkage bet-ween low molecular weight glutenin sub-units (LMW-GS) and gliadins (Gianibelli et al., 2001). Glutenins are polymeric pro-teins. They consist of two types of mole-cules: high molecular weight glutenin sub-units (HMW-GS) and low molecular weight glutenin subunits (LMW-GS) (Song et al., 2007) which are interconnected with disulphide bonds and possess elastic pro-perties. Glutenin subunits of large mole-cular weight are quantitatively minor com-ponents, but are crucial in the process of breadmaking since they determine the elasticity of gluten. LMW-GS compose about one-third of the total protein content of grain, and approximately 60% of the total glutenin. Despite their large quantity, they have been given less attention in research than the HMW-GS. This is main-ly a consequence of the difficulties that ari-se in their identification of the one-dimen-sional SDS-PAGE gels (Gianibelli et al., 2001) and newer techniques, such as automated capillary chip electrophoresis allow improved characterization of all the glutenin complex subunits.
Previous research has expressed mixed opinions regarding the impact of gliadin on the technological flour quality. Namely, the majority of authors believe that this in-fluence is conditioned by the quantity and quality of glutenin, whereas a smaller number prioritises gliadins, and some other authors consider the quantitative re-lationship between them by correlating it with the volume of bread (Unbehend et al., 2003).
The aim of this paper is to present results of testing qualitative characterization and quantitative gluten protein electrophoretic profiles of 4 domestic wheat production li-nes from 2008, and to correlate them with their technological quality.
MATERIAL AND METHODS
We have analysed samples of four winter wheat experimental lines formed in the selection centre of the Institute of Field and Vegetable Crops in Novi Sad:
The wheat samples come from the pro-duction year of 2007/2008 from the Novi Sad site. The criteria for their selection were the results of standard tests of tech-nological quality, so that in the wheat lines tested there are those which exhibited different levels of technological quality.
Rheological tests were performed by using Brabender farinograph, extensograph and amilograph, according to the Regulation of methods of physical and chemical analysis for quality control of grain, milling and ba-kery products, pasta and quickly frozen dough (Official Gazette no. 74/1988).
Characterization of gluten proteins, with prior fractionation to gliadin and glutenin fraction, was performed using an auto-matic chip electrophoresis using the Agi-lent 2100 Bioanalyzer apparatus (Agilent Technologies, Santa Clara, CA) using the Protein 230 Plus Lab Chip kit according to the method specified by the manufac-turer.
- Line 1
- Line 2
- Line 3
- Line 4
The wheat samples come from the pro-duction year of 2007/2008 from the Novi Sad site. The criteria for their selection were the results of standard tests of tech-nological quality, so that in the wheat lines tested there are those which exhibited different levels of technological quality.
Rheological tests were performed by using Brabender farinograph, extensograph and amilograph, according to the Regulation of methods of physical and chemical analysis for quality control of grain, milling and ba-kery products, pasta and quickly frozen dough (Official Gazette no. 74/1988).
Characterization of gluten proteins, with prior fractionation to gliadin and glutenin fraction, was performed using an auto-matic chip electrophoresis using the Agi-lent 2100 Bioanalyzer apparatus (Agilent Technologies, Santa Clara, CA) using the Protein 230 Plus Lab Chip kit according to the method specified by the manufac-turer.
Results and Discussion
Rheological tests performed on four do-mestic lines of wheat in order to assess their technological quality have shown that there are some differences in the values of specified parameters (Table 1).
Comparing the values of farinograph indi-cators, a sample of flour taken from the Line 1 showed the best quality which was confirmed by the value of the quality number, therefore belonging to the A2 quality group. Lines 2 and 4 showed extre-mely high water absorption, but also hi-gher values of softening degree, which is an indication of inadequate quality of pro-teins which are unable to retain absorbed water inside the dough.
Comparing the values of farinograph indi-cators, a sample of flour taken from the Line 1 showed the best quality which was confirmed by the value of the quality number, therefore belonging to the A2 quality group. Lines 2 and 4 showed extre-mely high water absorption, but also hi-gher values of softening degree, which is an indication of inadequate quality of pro-teins which are unable to retain absorbed water inside the dough.
Table 1.Value indicators of farinograph, extensograph and amilograph tested flour samples of four wheat lines
|
|
Line 1 |
Line 2 |
Line 3 |
Line 4 |
|
FARINOGRAPH |
||||
|
Water absorption (%) |
61 |
63,3 |
59,8 |
63,4 |
|
Dough development (min) |
2,4 |
1,9 |
2 |
1,8 |
|
Dough stability (min) |
1,7 |
1,4 |
1,1 |
1,3 |
|
Dough softness (BU) |
39 |
83 |
58 |
73 |
|
Quality number |
72,6 |
59 |
64 |
60,8 |
|
Quality class |
A2 |
B1 |
B1 |
B1 |
|
AMYLOGRAPH |
||||
|
Viscosity peak values (BU) |
499 |
592 |
785 |
273 |
|
EXTENSOGRAPH |
||||
|
Energy (cm2) |
77 |
57 |
97 |
71 |
|
Resistance (BU) |
293 |
240 |
371 |
277 |
|
Extensibility (mm) |
146 |
144 |
145 |
147 |
|
Ratio(resistance/exstensibility) |
2,05 |
1,72 |
2,62 |
1,93 |
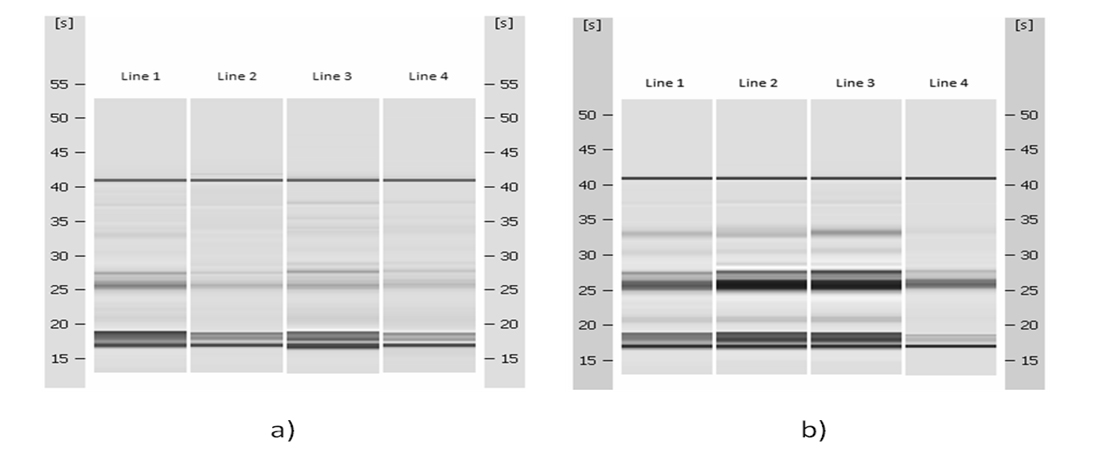
 Figure 1. Gel image of the electrophoretically separated flour protein fractions (glutenin and gliadin) of the four wheat lines
In terms of extensograph indicator value, differences between samples of flour were the least in terms of dough extensibility, which is basically on the same level in the case of all four examined samples of flour. As a result, all samples, except for the flour sample taken from the Line 3, are characterized by the value of the relative number which lies within the optimum, while the sample taken from the Line 3 due to the highest value of dough re-sistance has the highest energy value measured by extensograph.
Maximum viscosity valuesmeasured by the amilograph show that samples of flour taken from Lines 1 and 2 have values within the optimum needed for the pur-poses of bakery industry, while flour from the Line 3 has great maximum viscosity value and the sample taken from the Line 4 has a small one - both inappropriate for treatment in bakery. Figures 1a and 1b show the gel images of electrophoretically separated protein fractions of flour sam-ples originating from four domestic lines of wheat. On the one hand we can see the similarity of separated fractions of gluten complex protein found in the flour sam-ples, in a qualitative sense, which is re-flected in a similar distribution of protein bands in the bars as well as glutenin and gliadin. At the same time there is a visible difference in the intensity of the band co-lour on the gels, which represents different quantitative profiles of gluten fractions, that is, different amounts of separated fractions of glutenin and gliadin.
Gel image of glutenin fractions (Figure 1a) shows that the glutenin fractions are in the range of molecular masses of 14 to 210 kDa. All the samples have the highest amount of protein in the glutenin fractions examined in the range of molecular ma-sses of 35 and 60 kDa, where the sample of flour taken from Line 1 is significantly different in the above mentioned range when compared to the others. The results of electrophoretic testing of gliadin fraction (Figure 1b) show that a larger number of protein bands are also located in the area of molecular mass of 40 and 60 kDa. Also it has been noticed that there is a differ-rence in the quantity of total gliadins bet-ween the samples, where samples of flour from Lines 2 and 3 stand out by their in-creased content.
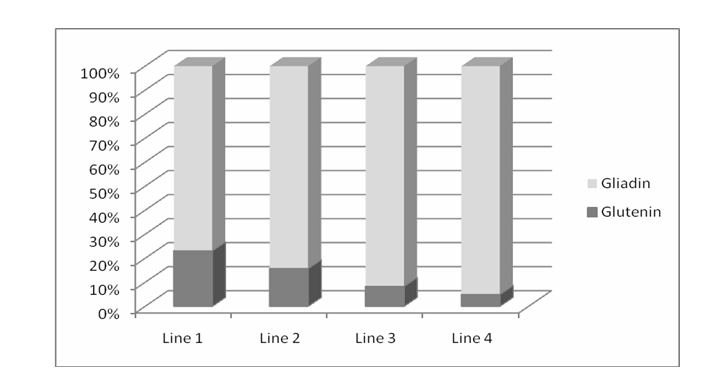
Looking at the quantitative ratio of gliadin to glutenin in gluten complex of wheat lines tested samples (Figure 2) it is noti-ceable that this ratio is different in the case of all samples. According to the literature data, the optimal ratio of glutenin and gliadin is around 1:1 (Fido et al., 1997; Peña, 2002; Radovanovic et al., 2002; Goesaert et al., 2005). However, by using different techniques of electrophoresis, different relationships are obtained in the same samples. Looking at the overall technological quality of the wheat lines tested, it can be concluded that the best technological quality was found in Lines 1 and 3. Bearing in mind that most authors agree that the technological quality of flour depends to a great extent on the glutenin fraction, by performing characterization of proteins of studied lines, it was found that the amount of gliadin also had an impact on the formation of technological quality.
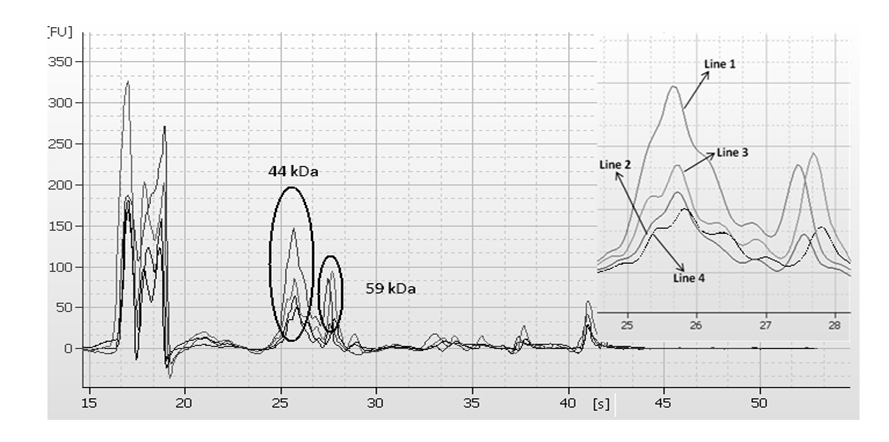
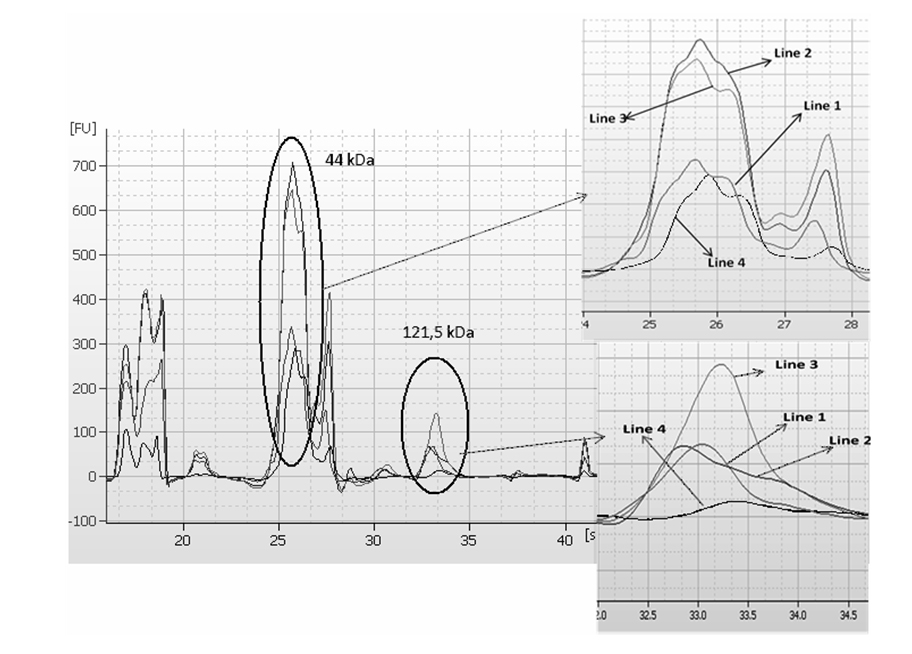
Electrophoretic examination (Figures 3 and 4) showed that both glutenin and glia-din profiles are quantitatively different in each specific area of molecular masses. In the case of glutenin, that are peaks of molecular masses of 44 and 59 kDa, and in the case of gliadin that are peaks of molecular masses of 44 kDa and 121.5 kDa.
Samples of wheat Lines 1 and 3 have the largest amounts of glutenins with these molecular weights, while samples of wheat Lines 2 and 3 have the largest amounts of gliadin (44 kDa and 121.5 kDa) .
Taking into consideration the rheological parameters, the sample of Line 1 has the best technological quality and the total quantity of glutenin, which is noticeable on electropherogram (Figure 2). On the other side, the sample of Line 3, which has the highest total content of gliadin, has a higher degree of softening and signifi-cantly more energy compared to the sam-ple line 1. Estimating the total technolo-gical quality, which was found to be better in sample Lines 1 and 3, it can be con-cluded that it was correlated with an in-creased amount of glutenin and gliadin with mentioned molecular masses.
This conclusion support the assumption that, in terms of quantity and structure, glutenins and gliadins have equal impact on the quality of wheat.
 Figure 2. The quantitative ratio of gliadin to glutenin in gluten complex of flour samples of four wheat lines
Conclusions
Characterization of gluten proteins revea-led that all investigated samples of wheat lines have a different quantitative ratio of gliadin to glutenin. Regarding the amount of glutenin fractions, the sample of Line 1 is distinguished by an increased content of this fraction in comparison to other sam-ples. There is an evident difference in the total amount of gliadin, with the samples of flour from wheat Lines 3 and 4 distin-guished by their increased content of this protein. Observing the total technological quality of tested wheat lines and taking into account the results of rheological tests, it can be concluded that the best te-chnological quality have Lines 1 and 3. Bringing in connection examination of ele-ctrophoretic studies with the rheological properties of flour samples using standard methods, it can be concluded that amounts and structures of both glutenin and gliadin are equal indicators of techno-logical quality of wheat.
ACKNOWLEDGEMENTS
This work was supported by the Project TR 31007, Ministry of Education and Science, Republic of Serbia.

 JOURNAL TOOLS


 INSTITUTE