Introduction
Yield is the major economic category, very complex in character. For most crops, it is dependant on genetic factors, environ-mental factors as well as their interactions, as was shown by Čačić et al. (2005). Under our environmental conditions, productive cultivation of sugar beet is impossible without cultivars highly tolerant to rhizomania. The first record of the presence of rhizo-mania in our country dates back to 1977. Larger areas infected with rhizomania were detected in Srem and Banat, and somewhat later in Bačka. This disease is manifested with leaf chlorosis, prolongation and narrowwing of leaf petioles, roots bearding and constriction. Rhizomania is caused by beet necrotic yellow vein virus (BNYVV). Rhizo-mania has been present in all areas cultivated with sugar beet (Table 1).
According to data reported by Bürcky (1995), a rapid rise in areas infected with rhizomania was observed in France. In Serbia, 5900 ha and 47700 ha of land were affected by the disease in 1983 and 1993, respectively.
Table 1. Land under sugar beet crop and total area infested with rhizomania in 2004
Country |
Area under sugar beet crop |
Infested area |
| ha |
% |
ha |
| Austria |
50 000 |
1,5 |
750 |
| Belgium |
100 000 |
1 |
1 000 |
| France |
400 000 |
5 |
20 000 |
| Germany |
445 000 |
4 |
18 000 |
| Greece |
45 000 |
3,5 |
1 575 |
| Italy |
240 000 |
1 |
3 600 |
| The Netherlands |
115 000 |
15 |
17 250 |
| Spain |
165 000 |
8 |
13 200 |
| Hungary |
60 000 |
10 |
6 000 |
| Turkey |
360 000 |
1 |
3 600 |
| Chile |
50 000 |
47 |
23 500 |
| USA |
600 000 |
35 |
210 000 |
| Total |
318 475 |
*According to data of Strube, Germany.
Today, rhizomania is wide spread in Serbia which has been confirmed by numerous field trials. Jasnić et al. (1999) reported that the infected area increased from 1357 ha in 1997 to 3790 ha in 1998 in the Province of Vojvodina. Beside rhizomania, land under sugar beet crop has been affected by other diseases such as Rhizoctonia solani.
Accurate data on Rhizoctonia solaniin-fected area in Serbia is missing but it has been estimated that around 8% or 6400 ha of the land under sugar beet has been affected. Approved cultivars of sugar beet investigated in the study were double tolerant to diseases (cercospora and rhizo-mania) and some of them were, in addition, tolerant to Rhizoctonia solani.
MATERIAL AND METHODS
In the observed period (2001-2008), varietal microtrials were conducted with sugar been cultivars passing the phase of official registration and approval. Total of 94 micro trials were set, each trial was replicated four times. Each cultivar was planted in four rows and harvested in two rows. The size of the basic plot was 20 m2 and the harvesting plot was 10 m2.
The investigated sugar beet cultivars were provided from the selections of KWS (Germany), Strube-Dieckmann (Germany), Hillechög (Sweden), Lion Seeds (England), Ses-Van der Have (Belgium, the Netherlands), Danisco (Denmark), Institute of Field and Vegetable Crops (Serbia) and "Selection" from Aleksinac (Serbia).
Laboratory analyses were done in the laboratory of the Institute for Food Technology, Novi Sad, Serbia according to the following methods:
- Sugar content in beet by the method of cold digestion;
- Alpha amino nitrogen according to V. Stanek - P. Pavlas (1934/35);
- Potassium and sodium content by Atomic Absorption Spectrophotometry (AAS).
The other quality parameters were calculated according to the following formulas:
- Sugar content in molasses (SM) (% on root) according to Reinelfeld et al. (1974):
- SM = 0.343 x (K+Na)+0.094 x alpha amino N-0.31. where K, Na and alpha amino N are given in mmol/100 g.
Sugar utilization (SU) (% on root) according to Reinelfeld et al. (1974):
- SU = D-SM-0.6 where D is sugar content (%). SM is sugar content in molasses (%). 0.6 refers to total losses.
Thick juice purity (Q) according to Wieninger and Kubadinov (1971):
Statistical analysis was performed using two-way ANOVA procedures according to Hadživuković (1973).
Agroecological conditions
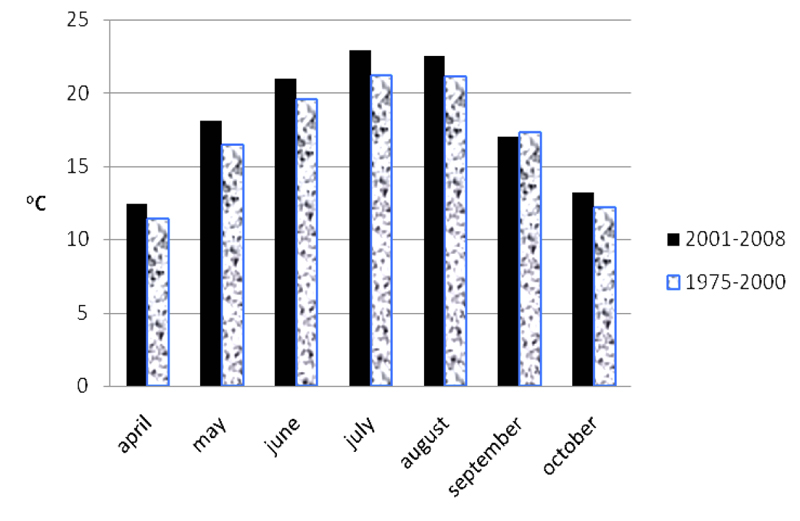
Average monthly air temperatures during the vegetation period, averaged over eight years, were generally higher compared to several-year means (Table 2, Figure 1).
Lower average monthly air temperature in comparison to several-year mean was recorded in September (-0.3 °C). Observing the average figures over the entire vegetation period, temperatures were higher by 1.1 °C, as compared to several-year means.
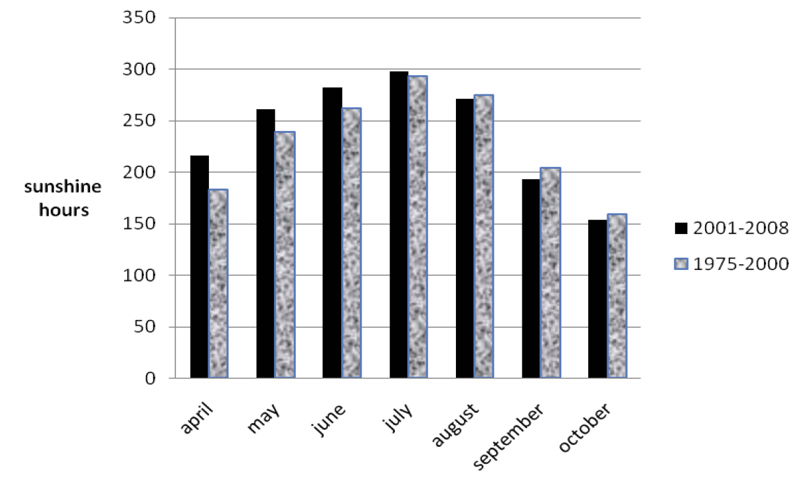
Mean monthly winter precipitation in the observed period (Table 3, Figure 2), slightly differed from the several-year means. Average precipitations over eight years were higher by 18.0 mm in the winter period, 19.0 mm in the vegetation period and 37.0 mm for total precipitations, as compared to several-year means Monthly sum of sunshine hours in the vegetation period, during the first four months (April-July), were higher than the several-year means in contrast to the last three months when they were lower (Table 4, Figure 3).
Table 2. Average monthly air temperatures (ºC) during vegetation, for period 2001-2008 (T) and their deviations (A) from means, for period 1975-2000
No. |
Year |
Months |
Mean values in vegatation period |
| Apr |
May |
Jun |
Jul |
Aug |
Sep |
Oct |
| T |
A |
T |
A |
T |
A |
T |
A |
T |
A |
T |
A |
T |
A |
T |
A |
| 1. |
2001 |
11.4 |
0.0 |
18.1 |
+1.6 |
18.5 |
-1.1 |
22.4 |
+1.2 |
23.3 |
+2.2 |
15.5 |
-1.8 |
14.1 |
+1.9 |
17.6 |
+0.6 |
| 2. |
2002 |
11.6 |
+0.2 |
19.5 |
+3.0 |
21.9 |
+2.3 |
24.0 |
+2.8 |
22.3 |
+1.2 |
17.3 |
0.0 |
13.2 |
+1.0 |
18.5 |
+1.5 |
| 3. |
2003 |
11.2 |
-0.2 |
20.7 |
+4.2 |
24.0 |
+4.4 |
22.8 |
+1.6 |
24.7 |
+3.6 |
17.6 |
+0.3 |
10.6 |
-1.6 |
18.8 |
+1.8 |
| 4. |
2004 |
12.7 |
+1.3 |
15.4 |
-1.1 |
20.0 |
+0.4 |
22.1 |
+0.9 |
21.7 |
+0.6 |
16.6 |
-0.7 |
14.6 |
+2.4 |
17.6 |
+0.6 |
| 5. |
2005 |
12.1 |
+0.7 |
17.0 |
+0.5 |
19.7 |
+0.1 |
22.1 |
+0.9 |
20.6 |
-0.5 |
18.2 |
+0.9 |
13.3 |
+1.1 |
17.6 |
+0.6 |
| 6. |
2006 |
13.5 |
+2.1 |
17.0 |
+0.5 |
20.0 |
+0.4 |
24.0 |
+2.8 |
20.7 |
-0.4 |
19.0 |
+1.7 |
15.1 |
+2.9 |
18.5 |
+1.5 |
| 7. |
2007 |
13.5 |
+2.1 |
18.9 |
+2.4 |
22.5 |
+2.9 |
24.0 |
+2.8 |
23.4 |
+2.3 |
15.5 |
-1.8 |
11.3 |
-0.9 |
18.4 |
+1.4 |
| 8. |
2008 |
12.9 |
+1.5 |
18.5 |
+2.0 |
21.7 |
+2.1 |
22.0 |
+0.8 |
23.0 |
+1.9 |
15.9 |
-1.4 |
13.7 |
+1.5 |
18.2 |
+1.2 |
| Mean: |
12.4 |
+1.0 |
18.1 |
+1.6 |
21.0 |
+1.4 |
22.9 |
+1.7 |
22.5 |
+1.4 |
17.0 |
-0.3 |
13.2 |
+1.0 |
18.1 |
+1.1 |
Several-year mean
(1975-2000) |
11.4 |
16.5 |
19.6 |
21.2 |
21.1 |
17.3 |
12.2 |
17.0 |
 Figure 1.
 Average monthly air temperatures during vegetation period
.jpg) Figure 1.
Figure 1. Average precipitations (mm) during vegetation period
Table 3. Precipitations (mm) in winter period, vegetation period, and total over 2001-2008 years in Vojvodina
No |
Year |
Winter precipitation (XI-III) |
Months |
Total prec.
in vege-
tation
period
(IV-X) |
Total
annual precipitation (XI-X) |
| Apr |
May |
Jun |
Jul |
Aug |
Sep |
Oct |
| 1 |
2001 |
270 |
33 |
26 |
20 |
24 |
5 |
52 |
13 |
173 |
443 |
| 2 |
2002 |
132 |
46 |
57 |
64 |
64 |
94 |
60 |
63 |
448 |
580 |
| 3 |
2003 |
149 |
18 |
34 |
28 |
81 |
14 |
59 |
124 |
358 |
507 |
| 4 |
2004 |
186 |
89 |
65 |
82 |
77 |
65 |
43 |
61 |
482 |
668 |
| 5 |
2005 |
281 |
58 |
49 |
95 |
109 |
129 |
61 |
11 |
512 |
793 |
| 6 |
2006 |
247 |
88 |
42 |
115 |
32 |
115 |
20 |
22 |
434 |
681 |
| 7 |
2007 |
221 |
4 |
92 |
84 |
30 |
52 |
72 |
101 |
435 |
656 |
| 8 |
2008 |
225 |
42 |
48 |
67 |
47 |
22 |
91 |
21 |
338 |
563 |
| Mean |
214 |
47 |
52 |
69 |
58 |
62 |
57 |
52 |
397 |
611 |
Several-year mean
(1975-2000) |
196 |
45 |
55 |
76 |
61 |
52 |
46 |
43 |
378 |
574 |
Table 4.Monthly sum of sunshine hours over period 2001-2008, during sugar beet vegetation period in Vojvodina
No. |
Year |
Months |
Sum for vegetation period
(IV-X) |
| Apr |
May |
Jun |
Jul |
Aug |
Sep |
Oct |
| 1. |
2001 |
344 |
268 |
238 |
277 |
298 |
151 |
188 |
1764 |
| 2. |
2002 |
198 |
238 |
290 |
275 |
226 |
166 |
142 |
1535 |
| 3. |
2003 |
193 |
283 |
333 |
289 |
325 |
218 |
133 |
1772 |
| 4. |
2004 |
164 |
233 |
259 |
272 |
297 |
194 |
137 |
1557 |
| 5. |
2005 |
173 |
254 |
293 |
277 |
198 |
190 |
156 |
1542 |
| 6. |
2006 |
175 |
254 |
253 |
344 |
206 |
231 |
219 |
1682 |
| 7. |
2007 |
318 |
264 |
309 |
354 |
289 |
199 |
115 |
1847 |
| 8. |
2008 |
164 |
298 |
279 |
300 |
326 |
195 |
134 |
1694 |
Mean
(2001-2008): |
216 |
261 |
282 |
298 |
271 |
193 |
153 |
1674 |
Several-year mean
(1975-2000) |
183 |
239 |
262 |
293 |
275 |
204 |
159 |
1615 |
 Figure 1.
 Monthly sum of sunshine hours during vegetation period
RESULTS AND DISCUSSION
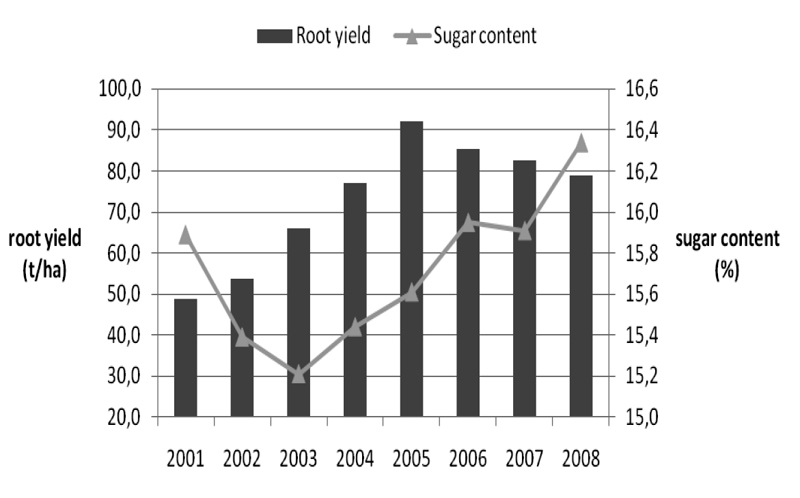
The lowest root yield (45.643 t/ha) was recorded for cultivar 11 in 2001 (Table 5). The highest root yield (95.967 t/ha) was achieved by cultivar 12 in 2005. The variation in the root yield between the extreme records was 50.324 t/ha or 110.26% (Figure 4).
Sugar content in root ranged from 14.62% (cultivar 2, in 2004) to 17.27% (cultivar 11, in 2008). The maximal differrence in sugar content was 2.65% absolute or 15.34% relative (Figure 4). The highest granulated sugar yield amounted to 12.902 t/ha in 2005 (cultivar 17) and the lowest was 5.841 t/ha in 2001 (cultivar 14).
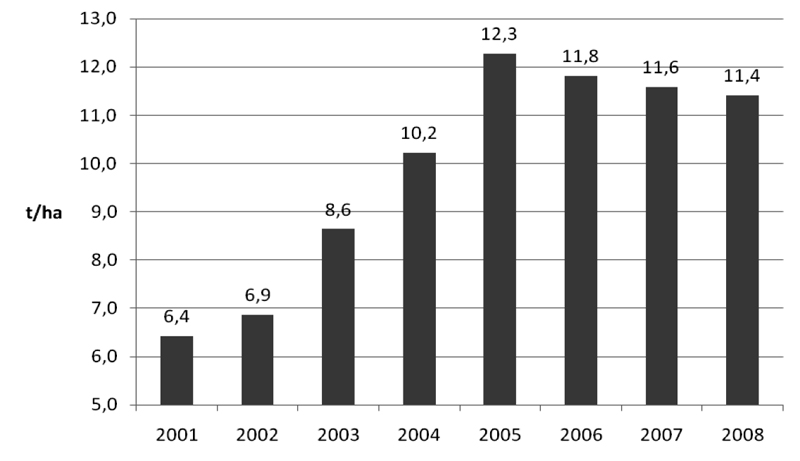
The difference in this parameter within the extremely ranked cultivars was 7.061 t/ha or 120.89% (Figure 5). Related to sugar utilization (expressed in % on beet), the highest figure (15.75%) was recorded for cultivar 19 in 2007 and the lowest of 12.18% for cultivar 2 in 2004.
The extreme difference in this parameter was 3.57% absolute or 22.67% relative. The highest thick juice purity of 95.39 was recorded in 2007 for cultivar 19 and the lowest (90.83) for cultivar 2 in 2004 which reflected a maximal difference of 4.56.
The lowest sugar content in molasses (0.86%) was achieved by cultivar 19 in 2007 and the highest (2.09) by cultivar 12 in 2001. The maximal difference within cultivars was 1.23%.
The lowest potassium content for the observed period was 13.65 mmol/100°S in the case of cultivar 19 in 2007 and the highest was 27.07 mmol/100°S by cultivar 12 in 2001. The maximal difference in this parameter was distinguished and amounted to 13.42 mmol/100S.
Extremely low sodium content (2.38 mmol /100°S) was determined in cultivar 12 in 2008 whereas significantly higher content (14.38 mmol/100°S) was found in cultivar 5 in 2005. The observed difference in the sodium content within the extremely ranked cultivars was high: 12.00 mmol/100°S or six-folded.
Cultivar 19 was the lowest in alpha-amino content in 2007 (10.21 mmol/100°S) whereas cultivar 9 was the highest with a figure of 24.98 mmol/100°S in 2002. The differrence in this parameter within the cultivars was significant and elevated: 14.77 mmol/-100°S or 2.45-folded.
Averaged over period 2001-2008 and within 117 approved cultivars and 94 micro trials, mean root yield was 73.097 t/ha. This mean root yield was higher by 24.13 t/ha or 33.02% as related to the lowest obtained in 2001 (Table 6). The mean root yield was positively correlated to the mean precipitations, with a coefficient of correlation of 0.66.
Table 5. Extreme figures (the best and worst) of the results obtained from the sugar beet field trials over period 2001-2008.
Indicators |
Year of approval |
Value |
Cultivar code |
| During period 2001-2008 |
The best |
Root yeild (t/ha) |
2005 |
95.967 |
12 |
| The worst |
2001 |
45.643 |
11 |
| The best |
Sugar content (%) |
2008 |
17.27 |
11 |
| The worst |
2004 |
14.62 |
2 |
| The best |
Gran.sugar yield (t/ha) |
2005 |
12.902 |
17 |
| The worst |
2001 |
5.841 |
14 |
| The best |
Sugar utilization
(% on beet) |
2007 |
15.75 |
19 |
| The worst |
2004 |
12.18 |
2 |
| The best |
Thick juice purity |
2007 |
95.39 |
19 |
| The worst |
2004 |
90.83 |
2 |
| The best |
Sugar content in molasses (%) |
2007 |
0.86 |
19 |
| The worst |
2001 |
2.09 |
12 |
| The best |
K (mmol/100oS) |
2007 |
13.65 |
19 |
| The worst |
2001 |
27.07 |
12 |
| The best |
Na (mmol/100oS) |
2008 |
2.38 |
12 |
| The worst |
2005 |
14.38 |
5 |
| The best |
α-amino N (mmol/100oS) |
2007 |
10.21 |
19 |
| The worst |
2002 |
24.98 |
9 |
 Figure 4.
 Average sum root yield and sugar content over period 2001-2008
Mean content of sugar in root, averaged over years, localities and cultivars was 15.72% and was higher than the minimal record (in 2003) by 0.51% absolute or 3.24% relative.
However, the established correlation coefficient between the mean sugar content and average precipitations was negative and amounted to -0.33.
The mean granulated sugar yield, averaged over years, localities and cultivars was very high (9.906 t/ha). It was higher by 3.483 t/ha or 35.16% as compared to that in 2001. The granulated sugar yield positively correlated to the mean precipitations over the observed period with a correlation coefficient of 0.58.
The mean sugar utilization (% beet root) averaged over years, localities and cultivars, was 13.57% and it was higher by 0.48% absolute or 3.54% relative as related to the minimal values recorded in 2002.
 Figure 4.
 Average sum granular sugar over period 2001-2008
Table 6.Average results of sugar beet micro-trials over period 2001-2008
Year
of approval |
No of approved cultivars
|
Root yield
(t/ha) |
Sugar content
(%) |
Granular sugar yield
(t/ha) |
Sugar utilization
(% on beet) |
Thick juice purity |
Sugar content in molasses
(% on beet) |
K |
Na |
α-amino
N |
| m mol/100ºS |
| 2001 |
6 |
48.964 |
15.89 |
6.423 |
13.39 |
91.54 |
1.90 |
25.75 |
9.41 |
19.64 |
| 2002 |
7 |
53.731 |
15.39 |
6.867 |
13.09 |
91.64 |
1.71 |
23.77 |
8.98 |
21.34 |
| 2003 |
11 |
66.024 |
15.21 |
8.642 |
13.10 |
92.35 |
1.51 |
20.70 |
9.14 |
19.29 |
| 2004 |
19 |
77.179 |
15.44 |
10.230 |
13.20 |
91.90 |
1.64 |
21.60 |
10.19 |
20.48 |
| 2005 |
21 |
92.036 |
15.61 |
12.280 |
13.29 |
92.06 |
1.72 |
23.12 |
10.34 |
17.70 |
| 2006 |
18 |
85.320 |
15.95 |
11.806 |
13.89 |
93.26 |
1.46 |
20.70 |
7.96 |
14.12 |
| 2007 |
15 |
82.615 |
15.91 |
11.595 |
14.09 |
93.84 |
1.24 |
18.19 |
6.52 |
13.98 |
| 2008 |
20 |
78.909 |
16.34 |
11.411 |
14.49 |
93.75 |
1.24 |
17.70 |
5.63 |
16.03 |
| Mean: |
Σ=117 |
73.097 |
15.72 |
9.906 |
13.57 |
92.54 |
1.55 |
21.44 |
8.52 |
17.82 |
| SD: |
- |
15.384 |
0.37 |
2.312 |
0.52 |
0.94 |
0.24 |
2.74 |
1.70 |
2.84 |
| CV (%): |
- |
21.045 |
2.36 |
23.343 |
3.86 |
1.01 |
15.14 |
12.77 |
19.91 |
15.95 |
The overall mean thick juice purity was good and reached the figure of 92.54. It was higher by 1.00 when compared to the minimal value registered in 2001.
The average content of sugar in molasses (% on beet), averaged over all factors, was 1.55% which is by 0.35% better in quality in comparison to the lowest value registered in 2001. The mean contents of potassium, sodium and alpha-amino nitrogen, averaged over years, localities and cultivars, were significantly better than those recorded in 2001.
Variation in the root yield for the observed period, ranged between 26.48% in 2001 to 12.98% in 2005, depending on the cultivar. The overall mean was 18.40%. The observed variation in the root yield was higher than that reported by Märländer (1991).
Considering the sugar content in root, the variations ranged from 2.55% (2001) to 13.31% in 2007. In average, the variation in this parameter was 8.07% which conforms to the findings of Märländer and Rothe (2005). The overall mean contents of sugar in root were in negative correlation with the sugar content in molasses, potassium, sodium and alpha-amino nitrogen in root similarly to the findings of Hoffmann and Märländer (2002).
The results also confirmed great variations in other quality parameters within the cultivars which were in similar range to those reported by Radivojević (1995).
The obtained results revealed a decreasing trend in the content of sugar in molasses (from 1.90 to 1.24% on beet), potassium content (from 25.75 to 17.70 mmol/100°S), sodium content (from 10.34 to 5.63 mmol/100°S) and alpha-amino nitrogen content (from 21.34 to 13.98 mmol/100°S). This observation harmonizes to that reported by Mahn and Hoffmann (2001).
There were also high differences in the content of alpha-amino nitrogen between the cultivars which ranged from 12.30 mmol/100°S to 19.83 mmol/100°S in 2008. Similar results were obtained from Hoffmann et al. (2002).
Variations in the granulated sugar yield between the cultivars were also significant and ranged between 10.52 in 2006 and 28.11 in 2002. The mean variation for the observed period was 16.84%. Koch (2007) reported similar results regarding granulated sugar yield.
The root yield reached the maximal value in 2005 and amounted to 92.036 t/ha or 87.97% of the yield registered in 2001. The observed rise in the root yield was much higher than that reported by Märländer (1991).
It is known that the variations in the sugar content are usually much lower than those in the root yield and granulated sugar yield. The mean variation in this parameter for the observed period was 7.43% rel. Identical variations were recorded in the study of Bongers and Bruhns (2003).
Variation in the granulated sugar yield was considerable, depending on the year observed. The lowest granulated sugar yield was recorded in 2001 at a level of 6.423 t/ha and the highest was 12.280 t/ha in 2005. Thus, the variation in the yield of granulated sugar was very high, 91.19%. Märländer (1991) reported lower variations in this parameter. Considerably lower variation in the granulated sugar content was reported by Čačić et al. (2009). Other quality parameters reached much better figures during 2007 and 2008 as compared to the first two years of study.
CONCLUSION
On the basis of numerous trials with sugar beet cultivars over period 2001-2008, conducted in the region of Vojvodina, the following conclusions were made:
- The mean root yield in the observed eight year period (averaged within cultivars and localities) was 73.097 t/ha, and was higher by 24.13 t/ha or 33.02% when compared to the lowest yield recorded in 2001. Maximal figure was registered in 2005 and this parameter was positively correlated to total precipitations.
- The sugar content in root, averaged over all factors, was 15.72% and this is by 0.51% abs. higher than that in 2003.
- The mean granulated sugar yield, averaged over all factors, was high with a figure of 9.906 t/ha. In comparison to the lowest yield registered in 2001, the granulated sugar yield was higher by 3.483 t/ha or 35.16%.
- The mean figures for sugar utilizetion, thick juice purity, sugar content in molasses and content of non-sugar compounds were much better than those registered in 2001.
ACKNOWLEDGEMENTS
The authors wish to acknowledge the Ministry of Agriculture, Forestry and Water Management, Department for Cultivar Registration for the support as well as their gratitude and appreciation to all those who participated the trials and the colleagues from the Institute for Food Technology in Novi Sad for their enormous help and assistance.
Download full article PDF
 DOWNLOAD PDF

 JOURNAL TOOLS


.jpg)


 INSTITUTE