SENSORY EVALUATION OF TRADITIONAL BREAD IN VOJVODINA
DOI:
UDK:
JOURNAL No:
Volume 35, Issue 3
PAGES
99-112
KEYWORDS
Traditional bread, Cipovka, Sensory evaluation, Untrained panellists, Consumers
Mladenka Pestorić1*, Milica Pojić1, Jasna Mastilović1, Olivera Šimurina1, Tatjana Tasić1, Dragan Živančev1, Dragana Šoronja-Simović2
1Institute for Food Technology, Novi Sad, Serbia
2 Faculty of Technology, Novi Sad, Serbia
ABSTRACT
Abstract
Cipovka is traditional Serbian bread that is produced in significant quantities in various parts of Serbia, especially in Vojvodina. It has always been one of the most popular and appealing food products due to its superior sensorial and textural characteristics. The perception of sensory characteristics of Cipovka is related not only to selected assessor’s or expert’s but also to consumer’s evaluations and their correlation too. The objective of this study was to find the differences between Cipovka samples by sensory analysis and to correlate the evaluations of untrained panellists (with the background in Cipovka processing) and consumers. The results of panellists’ evaluation were not completely in accordance with consumers’ evaluation. Among panellists certain assessors (oc12 and oc15) seemed to be equivalent in some aspects of sensory evaluation to consumers. Also, the sensory evaluation of Cipovka properties can be performed effectively without training when the product properties are familiar to the assessors. The further training of panellists as well as education of consumers would bring closer sensory evaluation of traditional product such as Cipovka.
INTRODUCTION
Bread and bakery products have an important role in Serbian everyday consumption. Cipovka, typical Sebian bread, is produced in significant quantities in various parts of Serbia, especially in Vojvodina. Cipovka has always been one of the most popular and appealing food product due to its superior sensorial and textural characteristics. For years, it has traditionally made according to the household recipe and culture.
However, the production of Cipovka and its popularity among consumers has considerably been declined due to global social and scientific modernization and increasing customer’s demands. Also, in general, the decrease of bread consumption that has been recorded is influenced by changing eating habits and wide selection of different types of bakery products (Siega-Ryz et al., 2000; Prätttälä et al., 2001; Škrbić and Filipčev, 2008).
According to the world, the market value in Vojvodina is being maintained by the growing interest in premiumpriced traditional and specialty breads, such as Cipovka. As traditional bread Cipovka represents an artisans’ product referring to specific location of manufacture with well-known ingredients: white wheat flour, water, salt and yeast.
Sensory evaluation of traditional products (Cayot, 2007, Dewettinck et al., 2008, Reida, O’Donnell and Downey, 2006) could be performed by panel (trained or untrained) or consumer testing. Sensory characteristics especially ones perceived by consumers play a key role. Consumers use numerous product criteria to evaluate whether a food product satisfies their expectations and requirements. Based on the multiple characteristics in a product, consumers adopt an attitude towards the certain products. However, a consumer-approach is not always used in practice mostly due to hedonic tests still performed by trained or untrained panellists. In order to obtain the overall sensory quality of food products in sensory evaluation it should be included product-oriented and consumer-driven approach (Issanchou, 1996; Roux, Le Couedic et al., 2000).
The main objective of this study was to evaluate the sensory quality of Cipovka, its appearance, textural and flavour acceptability by untrained panel of five assessors whose background were in the field of wheat flour processing and bread making and to compare the results of panel with consumers’ rating and preferences. All assessors were familiar with the specific way of processing and specific sensory properties of this product.
The first objective of this study was to check the possibility of recognition the specific sensory properties of Cipovka by untrained panel, to observe the differences between samples, and to rank five best samples. The second objective was to compare panels’ and consumers’ data.
MATERIAL AND METHODS
2.1. Samples
Thirteen Cipovka samples were evaluated where five of them were produced under artisan and eight under industry conditions. The samples were made from white wheat flour, 0.46-0.55 % d.b. (dry basis) ash content and weighted at least 500 g. During the evaluation by panel the samples were coded by randomly chosen numbers, while during the consumers’ evaluation five best evaluated samples were coded by the letters of alphabet (A, B, C, D, and E). In this paper the results are shown by using these codes.
2.2. Sensory evaluation
Specific sensory attributes of Cipovka: product appearance (shape, crust colour); slice appearance and structure (crust thickness, uniformity and fineness of pores, as well porosity scored according to Dallmann’s pore table (Dallmann, 1958)); odour and taste note; intensity and crust chewiness were evaluated by panel. Five panellists gave scores for each sample with respect to their perceptions attributes as 1 (worst) to 5 (best), by using visual, olfactory and gustatory techniques to evaluate aforementioned properties (Gaćeša, et al., 1998; Vukobratović et al., 2000). No replicates were performed. Between tasting, panellists cleaned their mouth with tap water (20 °C) and apples.
Consumers’ rating and preference tests were carried out to evaluate Cipovka quality. During the manifestation "The First Festival of Bread" that was held in Vojvodina, 82 consumers were rating five best evaluated breads by panellists. In the course of the leftover festival’s day 427 consumers were carried out preference test on the same samples and the best Cipovka was chosen between five as the most appealing one.
2.3. Statistical analysis
Statistical analysis included: factor analysis of distances by contingency tables. Statistical analysis of sensory evaluation of panel was conducted using software developed by Agency "SMARTLINE", Novi Sad.
RESULTS AND DISCUSSION
3.1. Sensory evaluation by panel
3.1.1. Grouping and selection of asse-ssors by properties
Providing that sensory evaluation was conducted by descriptive point system by panellists who were familiar with processing and specific sensory properties of Cipovka, but not by trained panellists, in this chapter the relationship between assessors with regard to their evaluations of selected sensory properties of Cipovka was analyzed.
Factor analysis was used to select the optimum numbers of factors by contingency tables for 5 assessors (oc11 - assessor 1; oc12 - assessor 2, oc13 - assessor 3; oc14 - assessor; oc15 - assessor 5. The aim of these structures was to notice the connection between individual assessors, determine the relative contribution of the factor to the assessor, and determine the relative contribution of assessor to the factor in order to select the assessors whose evaluation was in the best accordance with the other panellists.
3.1.1.1. Grouping and selection of assessors for appearance of Cipovka
3.1.1.1.1. Grouping and selection of asse-ssors for shape
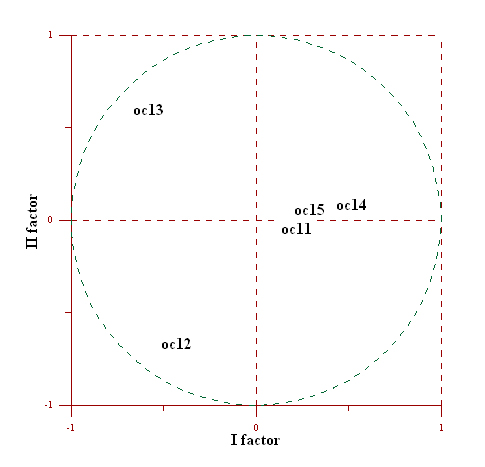
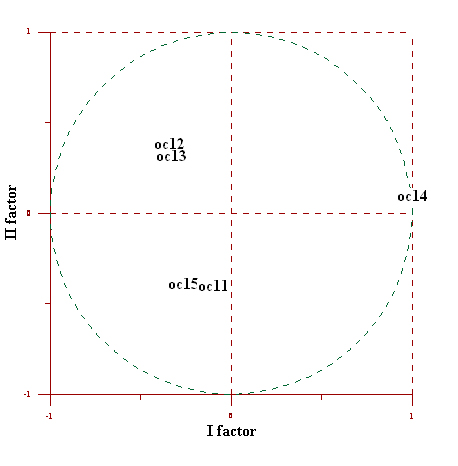
Structures of 2 factors of assessors for shape are shown in Table 1. On the basis of the value of 0.470 for inertia (Table 1), assessor oc13 differentiated from the others with regard to Cipovka shape. The first structure of separated factor was composed of three assessors oc13, oc14 and oc15 (Fig. 1). The relationship between them was inversely proportional. The second structure of separated factor was composed of assessors oc11, oc12 and oc15. Also, the latent contribution to the structure was obtained by oc14 ((cor) 0.343). The relationship between oc11 and oc12 was directly proportional, while the relationship between oc15 and oc14 was inversely proportional. As the highest contribution was obtained by oc11 ((cor) 0.998) in the second structure, the evaluation of this assessor was taken for further consideration.
Table 1. Structures of two separated factors for shape
|
|
1 - Factor |
2 - Factor |
|||||
|
Assessor |
in |
1F |
cor |
ctr |
2F |
cor |
ctr |
|
oc11 |
0.069 |
-0.017 |
0.002 |
0 |
-0.338 |
0.998 |
0.178 |
|
oc12 |
0.169 |
-0.117 |
0.049 |
0.013 |
-0.517 |
0.951 |
0.416 |
|
oc13 |
0.470 |
0.861 |
0.950 |
0.727 |
0.198 |
0.050 |
0.061 |
|
oc14 |
0.135 |
-0.384 |
0.658 |
0.145 |
0.277 |
0.342 |
0.120 |
|
oc15 |
0.158 |
-0.343 |
0.449 |
0.115 |
0.380 |
0.551 |
0.225 |
oc11-oc15 – assessors; in – inertia; F – factor coordinate; cor – relative contribution of the factor to the assessor; ctr – relative contribution of the assessor to the factor
3.1.1.1.2. Grouping and selection of assessors for crust color
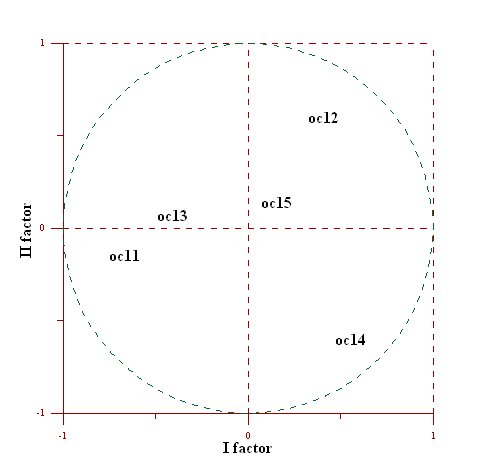
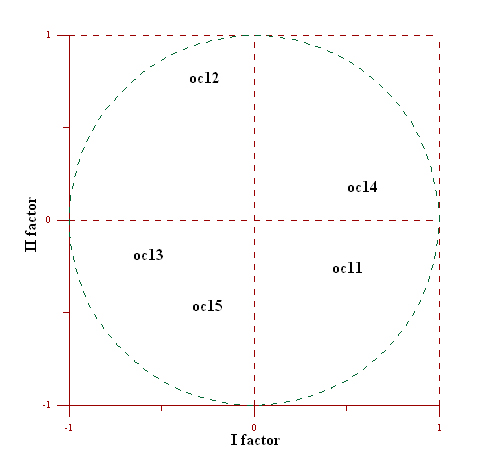
Obtained results of grouping and selection of assessors for crust colour showed that evaluation of oc11 was the most distinctive in comparison with other panellist ((in) 0.291). The first structure of separated factor was composed of four assessors oc13 ((cor) 0.978), oc12 ((cor) 0.964), oc15 ((cor) 0.729) and oc14 ((cor) 0.505) (Fig. 2). The relationship between oc13 and oc15 was proportional, while the relationship between oc13, oc12 and oc14 was inversely proportional. The second structure of separated factor was composed of two assessors oc11 ((cor) 0.818) and oc14 ((cor) 0.496). Also, the latent contribution to the structure was obtained by oc15 ((cor) 0.272). The relationship between oc11, oc14 and oc15 was inversely proportional. As the highest contribution was obtained by oc13 ((cor) 0.978) in the first structure, the evaluation of this assessors was taken for further consideration for crust colour.
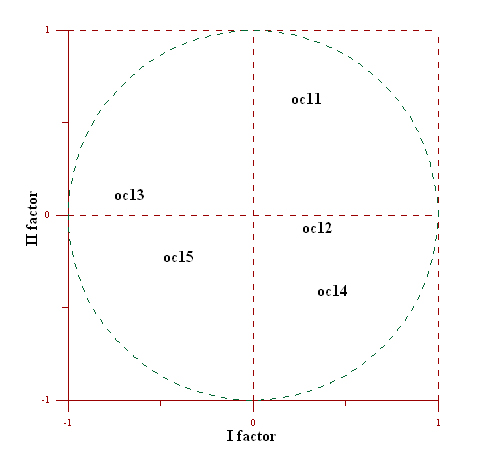 Fig. 2. Description of assessors for crust colur of Cipovka in separated factor structures 1F and 2F
3.1.1.2.. Grouping and selection of assessors for slice appearance and structure
3.1.1.2.1. Grouping and selection of assessors for crust thickness
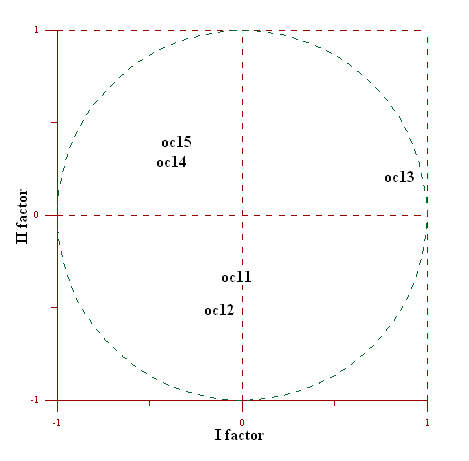
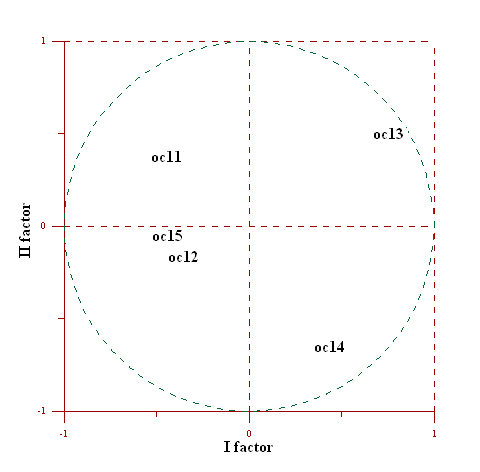
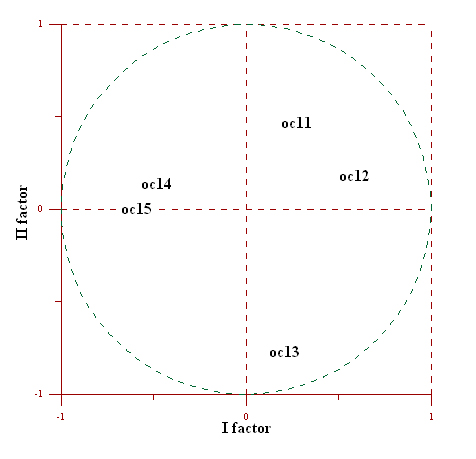
On the basis of the value of 0.333 for inertia, assessor oc15 differentiated from the others with regard to crust thickness. The first structure of separated factor was composed of four assessors oc13 ((cor) 0.982), oc12 ((cor) 0.907), oc11 ((cor) 0.879) and oc14 ((cor) 0.698) (Fig. 3).
The relationship between oc13 and oc11 was proportional, while the relationship o13, oc12 and oc14 was inversely proportional. The second structure of separated factor was composed of assessor oc15 ((cor) 0.976). The latent contribution to the structure was obtained by oc14 ((cor) 0.303. The relationship between oc15 and oc14 was inversely proportional. As the highest contribution was obtained by oc13 ((cor) 0.982) in the first structure, the evaluation of this assessor was taken for further consideration for crust thickness.
3.1.1.2.2. Grouping and selection of assessors for pores uniformity
Obtained results of grouping and selection of assessors for pores uniformity showed that evaluation of oc13 was the most distinctive in comparison with other panellist ((in) 0.405).
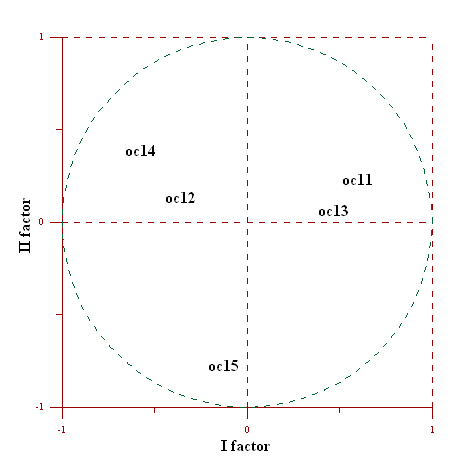
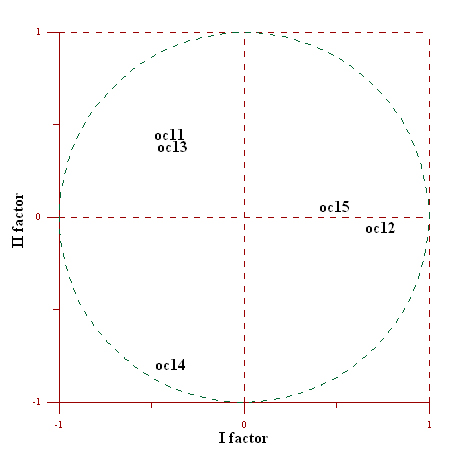
The first structures of separated factor was composed of four assessors oc15 ((cor) 0.996), oc14 ((cor) 0.954), oc11 ((cor) 0.914) and oc13 ((cor) 0.670) (Fig. 4).
The latent contribution to the structure was obtained by oc12 ((cor) 0.278). The relationship between oc15, oc14 and oc11 was proportional, but the relationship between oc15, oc13 and oc12 was inversely proportional. The second structure of separated factor was composed of assessor oc12 ((cor) 0.723).
The latent contribution to the structure was obtained by assessor oc13 ((cor) 0.331). The relationship between oc12 and oc13 was inversely proportional. As the highest contribution was obtained by oc15 ((cor) 0.996) in the first structure, the evaluation of this assessor was taken for further consideration for pores uniformity.
3.1.1.2.3. Grouping and selection assessors for porosity
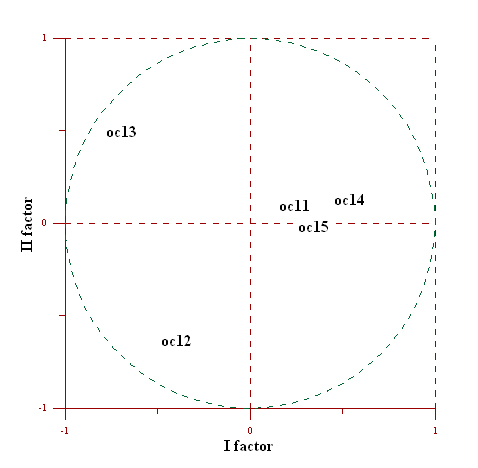
On the basis of the value of 0.393 for inertia, assessor oc13 differentiated from the others with regard to porosity. The first structures of separated factor was composed of four assessors oc14 ((cor) 0.981), oc15 ((cor) 0.975), oc11 ((cor) 0.974) and oc13 ((cor) 0.481) (Fig. 5). The latent contribution to the structure was obtained by assessor oc12 ((cor) 0.304). The relationship between oc14, oc15 and oc11 was proportional, while the relationship between oc14, c13 and oc12 was inversely proportional. The second structures of separated factor was composed of two assessors oc12 ((cor) 0.697) and oc13 ((cor) 0.520). The relationship between oc12 and oc13 was inversely proportional. As the highest contribution was obtained by oc14 ((cor) 0.981) in the first structure, the evaluation of this assessor was taken for further consideration for porosity of Cipovka.
3.1.1.2.4. Grouping and selection assessors for pores fineness
Obtained results of grouping and selection of assessors for pores fineness showed that evaluation of oc14 was the most distinctive in comparison with other panellist ((in) 0.363). The first structure of separated factor was composed of four assessors oc13 ((cor) 0.987), oc11 ((cor) 0.951), oc15 ((cor) 0.458) and oc14 ((cor) 0.448) (Fig. 6). The latent contribution to the structure was obtained by assessor oc12 ((cor) 0.336). The relationship between oc13 and oc11 was proportional, but the relationship between oc13, oc15, oc14 and oc12 was inversely proportional. The second structure of separated factor was composed of three assessors oc12 ((cor) 0.665), oc14 ((cor) 0.553) and oc15 ((cor) 0.543). The relationship between oc12 and oc15 was proportional, while the relationship between oc12 and oc14 was inversely proportional. As the highest contribution was obtained by oc13 ((cor) 0.987) in the first structure, the evaluation of this assessor was taken for further consideration for pores fineness.
3.1.1.3. Grouping and selection of assessors for odour
3.1.1.3.1. Grouping and selection of assessors for odour note
Obtained results of grouping and selection of assessors for odour note showed that evaluation of oc13 was the most distinctive in comparison with other panellist ((in) 0.398). The first structure of separated factor was composed of four assessors oc15 ((cor) 0.994), oc12 ((cor) 0.848), oc13 ((cor) 0.720) and oc11 ((cor) 0.593) (Fig 7). The latent contribution to the structure was obtained by assessor oc14 ((cor) 0.300). The relationship between oc15, oc12 and oc11 was proportional, while the relationship between oc15, oc13 and oc14 was inversely proportional. The second structures of select factor was composed of two assessors oc14 ((cor) 0.701) and oc11 ((cor) 0.408). The latent contribution to the structure was obtained by assessor oc13 ((cor) 0.281). The relationnship between oc14, oc11 and oc13 was inversely proportional. As the highest contribution was obtained by oc15 ((cor) 0.994) in the first structure, the evaluation of this assessor was taken for further consideration for odour note.
3.1.1.3.2. Grouping and selection of assessors for odour intensity
Obtained results of grouping and selection of assessors for odour intensity showed that evaluation of oc14 was the most distinctive in comparison with other panellist ((in) 0.372).
The first structure of separated factor was composed of four assessors oc12 ((cor) 0.992), oc15 ((cor) 0.989), oc13 ((cor) 0.509) and oc11 ((cor) 0.449) (Fig 8). The latent contribution to the structure was obtained by assessor oc14 ((cor) 0.215. The relationship between oc12 and oc15 was proportional, while the relationship oc12, oc13, oc11 and oc14 was inversely proportional. The second structures of separated factor was composed of three assessors oc14 ((cor) 0.786), oc11 ((cor) 0.552) and oc13 ((cor) 0.492). The relationship between oc14, c11 and oc13 was inversely proportional. As the highest contribution was obtained by oc12 ((cor) 0.992) in the first structure, the evaluation of this assessor was taken for further consideration for odour intesity.
3.1.1.4. Grouping and selection of assessors for taste of Cipovka
3.1.1.4.1. Grouping and selection of assessors for taste note
Obtained results of grouping and selection of assessors for taste note showed that evaluation of oc14 was the most distinctive in comparison with other panellist ((in) 0.540). The first structure of separated factor was composed of three assessors oc14 ((cor) 0.991), oc13 ((cor) 0.482), oc12 ((cor) 0.450) (Fig. 9). The latent contribution to the structure was obtained by assessor oc15 ((cor) 0.220). The relationship between oc14, oc13, oc12 and oc15 was inversely proportional. The second structure of separated factor was composed of four assessors oc11 ((cor) 0.916), oc15 ((cor) 0.781), oc12 ((cor) 0.551) and oc13 ((cor) 0.519). The relationship between oc11 and oc15 was proportional, but the relationship between oc11, oc12 and oc13 inversely proportional. As the highest contribution was obtained by oc11 ((cor) 0.916) in the first structure, the evaluation of this assessor was taken for further consideration for taste note.
3.1.1.4.2. Grouping and selection of assessors for taste intensity
Obtained results of grouping and selection of assessors for taste intensity showed that evaluation of oc12 was the most distinctive in comparison with other panellist ((in) 0.320). The first structure of separated factor was composed of three assessors oc14 ((cor) 0.918), oc13 ((cor) 0.903) and oc11 ((cor) 0.786) (Fig. 10). The latent contribution to the structure was obtained by assessor oc15 ((cor) 0.230). The relationship between oc14 and oc11 was proportional, while the relationship between oc14, oc13 and oc15 inversely proportional. The second structure of separated factor was composed of two assessors oc12 ((cor) 0.897) and oc15 ((cor) 0.771). The latent contribution to the structure was obtained by oc11 ((cor) 0.215). The relationship between oc12, oc15 and oc11 was inversely proportional. As the highest contribution was obtained by oc14 ((cor) 0.918 in the first structure, the evaluation of this assessor was taken for further consideration for taste intensity.
3.1.1.5. Grouping and selection of assessors for crust chewiness
Obtained results of grouping and selection of assessors for crust chewiness showed that evaluation of oc13 was the most distinctive in comparison with other panellist ((in) 0.342). The first structure of separated factor was composed of three assessors oc15 ((cor) 1.000), oc14 ((cor) 0.924) and oc12 ((cor) .908) (Fig. 11). The latent contribution to the structure was obtained by assessor oc11 ((cor) 0.286). The relationship between oc15 and oc14 was proportional, while the relationship between oc15, oc12 and oc11 was inversely proportional. The second structure of separated factor was composed of two assessors oc13 ((cor) 0.928) and oc11 ((cor) 0.733). The relationship between oc13 and oc11 was inversely proportional. As the highest contribution was obtained by oc15 ((cor) 1.000 in the first structure, the evaluation of this assessor was taken for further consideration crust chewiness.
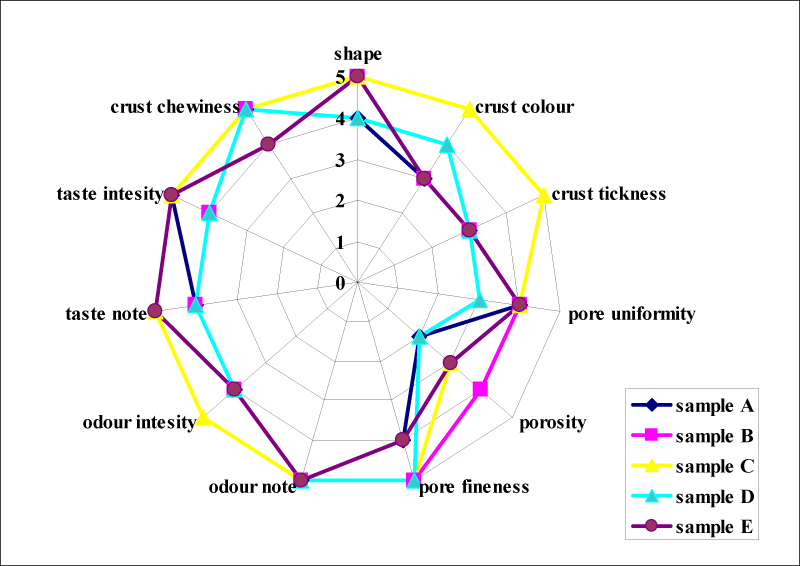
Taking into account the evaluations of assessors selected by structures of certain Cipovka properties, the ranking of the best five samples was obtained where the dominant position had sample C (with 52 points). The other samples were ranked as sample B (46 points), sample E (45 points) and samples A and D with 43 points. Concerning the individual properties of Cipovka, it could be noticed that the smallest perceived differences between samples were obtained for odour and taste as well as crust chewiness. The more significant differences were noticed for the shape of the product and crust colour, while slice appearance and structure were the properties with the most significant differences between samples (Fig. 12). This finding confirmed that untrained panel could successfully notice the differences between samples only if the unique Cipovka properties were taken into account. Thus, the sensory evaluation of Cipovka properties can be performed effectively without training when the assessors are familiar to specific product properties.
3.2. Consumers’ perception of Cipovka
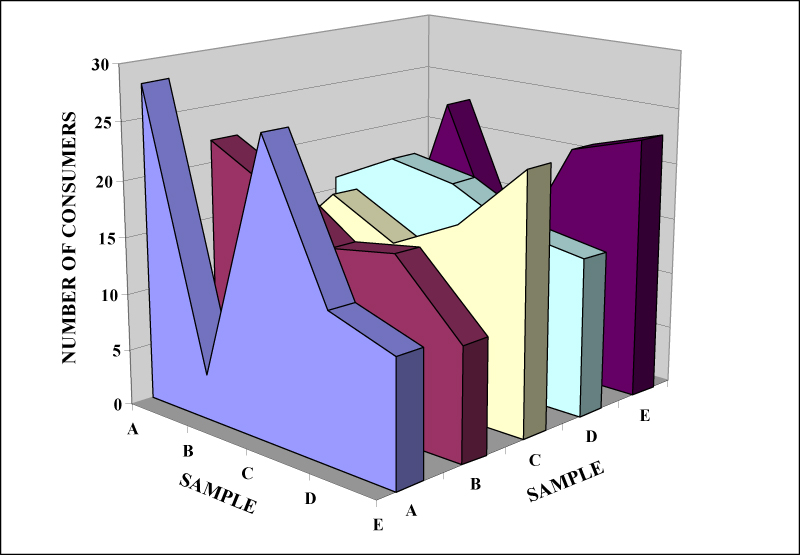
The analysis of the collected data was focused on the perception of Cipovka using consumers’ ranking and preference tests. In the first test, 82 consumers were ranking five best evaluated breads by untrained panellists and the samples were evaluated in following order: A, C, D, E, and B (Fig. 13).
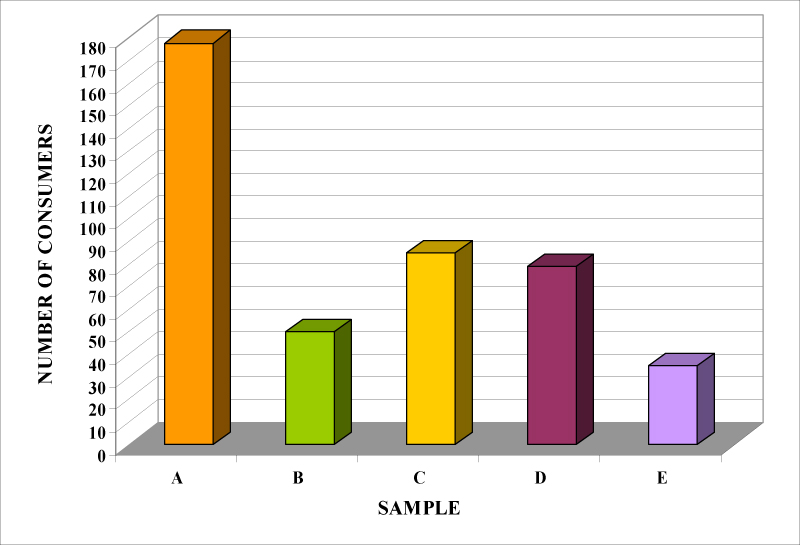
The similar results were obtained by preference test carried out on the same samples by 427 consumers who were chosen between five as the most appealing one (Fig. 14). It could be noticed that consumer’s perception can be the same as it was based on ranking and preference tests with the exception of consumers’ evaluation of samples B and E. Furthermore, the consumers more than likely choose the most acceptable samples between the offered samples rather than to rank them.
3.3. Comparison between panelists’ and consumers’ data
The comparison of the results of sensory evaluation obtained by untrained panel on the one and consumers on the other side showed that the same rank for five evaluated samples were not achieved. Assessors oc12 and oc15 assigned the same and the highest score for the best ranked sample according to consumers’ evaluation (sample A). At the level of individual assessors oc12 and oc15 seemed to be equivalent in some aspects with consumers: they both present a couple of assessors who clearly are identical with consumers in some properties. In fact, the authors envisage the possibility that the crust colour, note of odour and taste have been shown to be the most salient factors in the process of Cipovka choice by consumers. Furthermore, as pointed out by Granitto et al. (2008), the consonance among single assessors and assessors and consumers could be necessary, using considerable the training process (O’Sullivan et al., 2003). Moreover, training of panellists and provision of reference samples become more relevant when more subtle product properties should be evaluated. As consumers become more familiar with a new product they will be better to evaluate the quality of Cipovka. In general, these findings may have relevance to the retail sector especially when new and untypical bread products are introduced into the marketplace. Thus, the consumer will not be familiar with the specific quality criteria, which determine the sensory quality of Cipovka, but as they become better acquainted with the Cipovka they will be in a better position to objectively evaluate such quality. This finding confirmed that the choice of Cipovka to a great extent depended on consumer’s beliefs and attitudes which were in accordance with the statements of many authors who also underlined that the product must be driven by the consumer expectations and perceptions (Issanchou, 1996; Roux, et al., 2000; Biloukha and Utermohlen, 2000; Alvelos and Cabral, 2007; Dewettinck et al., 2008). Also, it was shown that the consumer preferences were not completely related to the quality grades, which was in accordance with the earlier studies confirming that the perception of the sensory characteristics of a product was related not only to its intrinsic characteristics but also to other parameters such as brand, origin, nutritional facts, price, consumer’s perceptive abilities and their psychological and social aspects (Cayot, 2007).
CONCLUSION
On the basis of obtained results it can be concluded that untrained panellists could effectively differentiate samples with regard to its unique properties if they are familiar with processing and specific sensory properties of Cipovka. The results of panellists’ evaluation were not completely in accordance with consumers’ evaluation. Furthermore, the consumers’ perception can be the same as it was based on ranking and preference tests with the exception of consumers’ evaluation of samples B and E. Also, the consumers more than likely choose the most acceptable samples between the offered samples rather than to rank them. Assessors oc12 and oc15 assigned the same and the highest score for the best ranked sample according to consumers’ evaluation (sample A). At the level of individual assessors oc12 and oc15 seemed to be equivalent in some aspects to consumers: they both present a couple of assessors who clearly are identical with consumers in some properties. Therefore, they may be analogous to the consumers in how they perceive the variation of specific properties of Cipovka. The further training of panellists as well as education of consumers would bring closer sensory evaluation of traditional product such as Cipovka. In general, these findings may have relevance to the retail sector especially when new and untypical bread products are introduced into the marketplace. Thus, the consumer is not familiar with the specific quality criteria, which determined the sensory quality of Cipovka, but as they will have become better acquainted with the Cipovka they will be in a better position to objecttively evaluate such quality. In particular, the results of present study could be useful for identifying specific properties of traditional bread – Cipovka and for the development of strategy for consumer education and information’s campaigns. In order to obtain the overall sensory quality of food products in sensory evaluation, product-oriented and consumer-driven approach should be included.
ACKNOWLEDGMENTS
This work was financed by the Ministry of Science and Technological Development, Republic of Serbia (Project No. 20066).

 JOURNAL TOOLS


 INSTITUTE