Food & Feed Research

IDENTIFICATION AND SELECTION OF THE DESCRIPTORS FOR ESTABLISHING A SENSORY PROFILE OF TOMATO BY A MULTIDIMENSIONAL APPROACH

DOI:
UDK:
JOURNAL No:
Volume 39, Issue 1
PAGES
33-40
KEYWORDS
descriptors, sensory profile, multidimensional approach, tomato
TOOLS Creative Commons License
Miona M. Belović*1, Mladenka V. Pestorić1, Jasna S. Mastilović1, Žarko S. Kevrešan1
1University of Novi Sad, Institute of Food Technology, 21000 Novi Sad,
Bulevar cara Lazara 1, Serbia

ABSTRACT

The objective of this research was to create the list of descriptors that would determine the quality differences between the fresh tomato samples. The samples purchased from local markets were evaluated by a trained panel. The free choice profiling (FCP) method was used for the generation of descriptors. One way of reducing the number of descriptors was performed on the basis of their classification by geometric means (M). Sequential principal component analysis (PCA) was carried out in order to exclude descriptors with low contribution to the total variance. The final list included descriptors of appearance (11), texture (3), odour (2), and taste (2), and their definitions as well. This research confirmed that the multidimensional approach could be used as a good sensory method for developing the sensory profile of fresh tomato.

Introduction


Quality of fresh tomato is determined by nutritional value and sensory properties (appearance, texture, and flavour) (Kader et al., 1978). The sensory analysis is commonly used to determine the optimal harvest maturity and storage conditions, as well as to monitor the quality changes during postharvest life of agricultural products. Moreover, it is the essential part of a new tomato cultivar breeding process (Echeverria et al., 2008). Many researches of tomato sensory quality were dedicated to comparison of results obtained by trained sensory panel and/or consumers with instrumental data. In general, they were mostly focused on tomato flavour (Sinesio et al., 2000; Maul et al., 2000; Tandon et al., 2003; Berna et al, 2005; Krumbein et al., 2004). The relationship between the sensory perception and instrumental measurements of ripe harvested tomatoes stored under retail conditions were investigated by Auerswald et al. (1999). The results of quantitative descriptive analysis were significantly correlated with some instrumental measurements (colour, firmness) and chemical analyses (titratable acidity, reducing sugars, etc.). Furthermore, this research showed which of perceptible changes during storage were important for consumers.
In order to create the sensory profile of tomato, it is necessary to select appropriate descriptors. They are defined as product’s perceptible attributes that are assessed on the intensity scale. The list of descriptors can be determined by the consensus method, the independent method as well as by the multidimensional approach for establishing a product’s profile (ISO 11035, 1994). However, this list is extensive, usually containing irrelevant and redundant terms, and therefore cannot be used for fast evaluation of different products. The multidimensional approach enables evaluation of relative importance and contribution of descriptors in products’ differentiation because it provides visualization of all products as well as correlations between descriptors simultaneously. Identification of descriptors’ closeness and weights enables their elimination or grouping (ISO 11035, 1994).
Hongsoongnern and Chambers (2008) conducted one of more comprehensive researches of tomato sensory properties using PCA with both the correlation and covariance procedures in order to investtigate the relationships within the sensory set-data. They also created a lexicon for texture and flavour characteristics of fresh and processed tomatoes that included 5 aroma attributes, 10 texture attributes and 18 flavour attributes including 6 taste and mouthfeel attributes. Moreover, they provided definitions, references and intenseties on a 15-point scale for each attribute.
PCA is applied extensively in sensory analysis for identification and selection of descriptors (Hayakawa et al. 2010), investigation of panel consonance and interacttions among different sensory attributes (Echeverria et al. 2008), and selection of descriptive terms (Barcenas et al. 1999).
Referring to all mentioned above, the objective of this research was to create the list of descriptors that would determine the quality differences between the fresh tomato samples.

MATERIAL AND METHODS

Samples

Five samples of fresh tomatoes were selected to cover all possible qualitative differences in terms of size, shape, colour and firmness that could be observed during sensory evaluation. All samples were purchased from local markets on the day of evaluation.

Sensory evaluation

Sensory profiling was performed by the seven trained panellists, 6 females and 1 male, aged between 25 and 50 years. They were selected from previously trained academic staff of the Institute of Food Technology, Novi Sad. The sensory evaluation was carried out in the single booths under defined conditions according to SRPS ISO 8589 (1998). Each assessor could use the instructions for generating the detailed list of descriptors as guidelines during evaluation. All samples were presented to each assessor at the same time. The free choice profiling (FCP) method was performed for the generation of descriptors. The intensity scale (from 0 - absence of perception to 5 - strong perception) was applied to express intensity of each observed descriptor (SRPS ISO 4121, 2002). Similar descriptive terms were grouped together in order to simplify obtained list by consensus method. During the session, panel leader together with panellists discussed each proposed descriptor, where redundant, synonymous and vague terms were removed from the list.

Data analysis

To explore the relationships among the established sensory descriptors and to estimate the relative importance and contribution of descriptors for products differentiation, PCA analysis was performed using the Software XLSTAT, version (2012.2.02) (http://www.xlstat.com/).

Results and Discussion

The list of 39 descriptors, selected on the basis of panellists’ perception, is presented in Table 1, along with their abbreviations and geometric means (M - values) for each product. The first reduction of descriptors was performed on the basis of their classification by M - value, which is the square root of the product of frequency (F) and relative intensity (I) of each descriptor:
(1)
where is:
F – number of descriptor’s mentions divided by the total possible number of this descriptor’s mentions, expressed as percentage.
I – sum of intensities given by the entire panel for descriptor divided by the maximum possible intensity of this descriptor, expressed as percentage.
Table 1. Initial list of descriptors, abbreviations and M – values for each product

Descriptor

Abbreviation

M – value (%)

Product 1

Product 2

Product 3

Product 4

Product 5

Whole fruit


Shape regularity

SH

81.24

84.85

88.32

70.71

73.48

Size

S

63.89

60.61

47.38

53.45

49.49

Colour

C

82.81

95.62

87.83

67.61

65.47

Colour uniformity

CU

81.06

94.11

91.03

58.55

58.55

Surface smoothness

SS

25.56

23.90

23.90

22.13

20.20

Mechanical damage

MD

43.89

49.19

32.20

51.64

51.64

Scar size

SCS

12.78

11.07

9.04

11.07

9.04

Scar regularity

SCR

6.39

12.78

14.29

6.39

11.07

Skin cleanness

SC

23.90

23.90

25.56

18.07

18.07

Skin brightness

SB

60.61

49.49

60.61

47.38

47.38

Surface green decolourization

SGD

15.65

20.20

20.20

27.11

9.04

Firmness

F

83.00

89.44

85.63

68.31

84.33

Skin wilting

SW

42.86

45.18

42.86

49.49

53.45

Skin elasticity

SE

15.65

11.07

22.13

27.11

25.56

Cross -section


Cross-section colour

CSC

47.38

62.27

63.89

55.33

62.27

Cross-section colour uniformity

CSCU

68.21

63.89

73.40

58.55

73.40

Fruit fleshiness

FF

22.13

22.13

22.13

28.57

27.11

Fruit compactness

FC

58.90

60.61

49.49

67.01

60.61

Juice leakage

JL

57.14

55.33

62.27

60.61

64.52

Vessels

V

58.55

58.55

77.46

65.47

73.68

Unripe layers

UL

12.78

9.04

14.29

6.39

9.04

Cross-section green decolourization

CSGD

6.39

6.39

6.39

12.78

9.04

Skin thickness

ST

22.13

22.13

18.07

25.56

23.90

Skin peeling

SP

33.20

33.20

15.65

15.65

15.65

Seeds

SEEDS

12.78

12.78

11.07

6.39

9.04

Texture in mouth


Skin chewiness

SCH

49.49

62.60

71.71

71.71

47.81

Firmness

FM

40.41

34.99

38.33

27.11

31.30

Solubility

SM

11.07

12.78

9.04

14.29

14.29

Juiciness

J

33.20

46.07

47.81

44.26

33.20

Chewiness

CH

53.45

69.99

53.45

75.05

51.11

Mealiness

M

46.07

31.30

29.28

19.17

24.74

Covering of oral cavity

COC

12.78

11.07

12.78

12.78

12.78

Odour and taste


Odour

OD

84.52

79.28

69.69

56.42

63.25

Off-odour

OOD

6.39

6.39

6.39

18.07

9.04

Sour taste

SOT

44.26

36.14

49.49

42.38

36.14

Sweet taste

SWT

56.42

51.51

77.46

53.45

71.71

Off-taste

OFFT

12.78

9.04

14.29

6.39

9.04

Flavour

FL

15.65

22.13

22.13

20.20

27.11

After taste

AT

33.20

34.99

20.20

25.56

38.33


The shaded small M values and M values which did not contribute to good differentiation of the samples were removed from further data processing.
PCA was performed on the correlation matrix of 25 retained descriptors (variables). The first two principal components (F1 and F2) explained 70.41% of the total variance (F1=40.93%, F2=29.48%). Shaded descriptors were excluded from further analysis because of their low squared cosines (Table 2).
Namely, a high magnitude (near to +1 or -1) for factor loading means that the variable is highly correlated with that factor, but >0.5 can be enough for importance (Bower, 2009). Bearing in mind the fact that the preconditions for the application of PCA are more conceptual than statistical, the first sequential PCA was performed on the correlation matrix of the remaining descriptors (Pestoriæ, 2011).
The first two factors explained 82.32% of the total variance. In this step, cross-section colour was eliminated from the list of descriptors, as well as firmness evaluated by palpatory technique (Figure 1). It was less convenient textural descriptor than firmness evaluated in mouth, considering the squared cosines values.

Table 2. Squared cosines of descriptors after first reduction of their number

Descriptor

F1

F2

SH

0.864

0.000

S

0.023

0.966

C

0.580

0.097

CU

0.715

0.039

MD

0.643

0.199

SCR

0.272

0.255

SB

0.703

0.001

F

0.604

0.008

CSC

0.006

0.413

CSCU

0.382

0.246

FC

0.774

0.225

JL

0.067

0.739

V

0.004

0.966

SP

0.173

0.810

SCH

0.010

0.157

FM

0.912

0.043

J

0.009

0.092

CH

0.346

0.099

M

0.503

0.347

OD

0.577

0.417

OOD

0.825

0.017

SOT

0.207

0.157

SWT

0.140

0.740

OFFT

0.868

0.038

AT

0.026

0.298

Values in bold correspond for each variable to the factor for which the squared cosine is the largest
Figure 1. PCA plot of relationship between the descriptors and differentiation between the samples after the first reduction
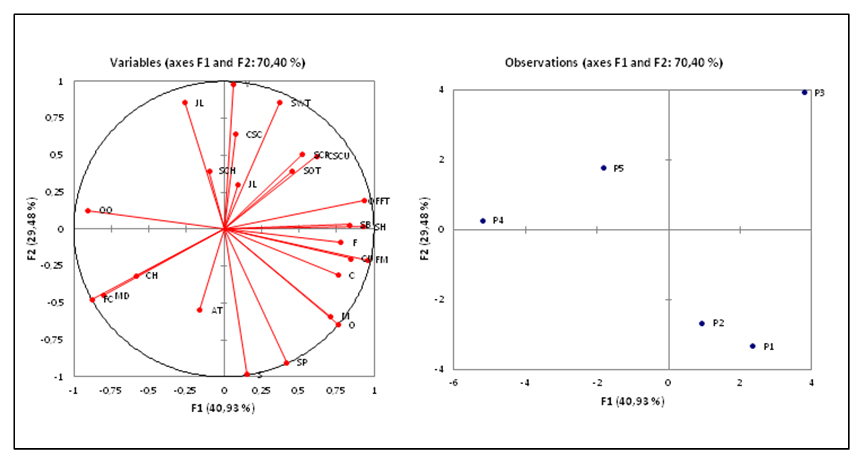
Figure 2. PCA plot of relationship between the descriptors and differentiation between the samples after the third reduction

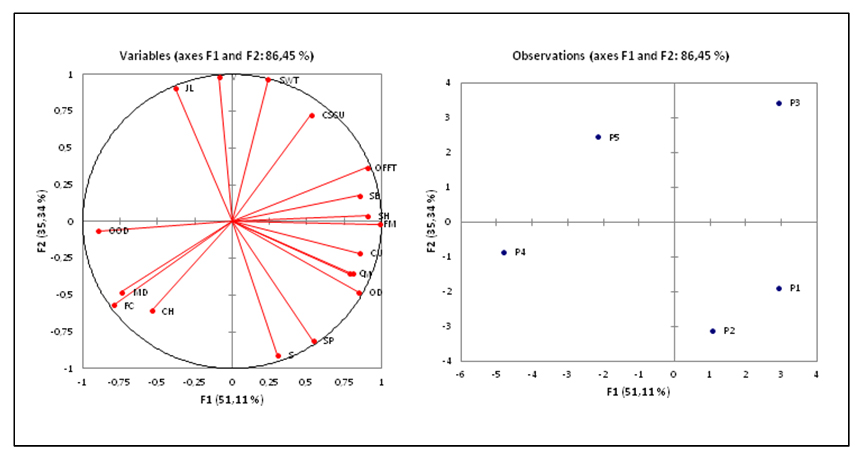
The second sequential PCA explained 86.45% of the total variance (F1=51.11%, F2=35.34%). All retained descriptors sho-wed high correlations with principal com-ponents (Figure 2).
Elimination of descriptors and the perfor-med sequential PCAs did not contribute to significant change of products’ positions in PCA plot (Figures 1 and 2). Products P1 and P2 were both located in the fourth quadrant and they had some similarities in terms of size, skin peeling, odour, mealiness and colour uniformity. Product P3 is distinguished from other samples by its cross-section colour uniformity, P4 by off-odour, mechanical damage and fruit compactness, and P5 by juice leakage.
Established sensory profile of fresh tomato is presented in Table 3.

Table 3. The established final list of descriptors and definitions.

Descriptor

Abbreviation

Definition

APPEARANCE

Whole fruit

Shape regularity

SH

Symmetry of the fruit (cultivar characteristic)

Size

S

Size of the fruit (cultivar characteristic)

Colour

C

Intensity of fruit red colour

Colour uniformity

CU

Areas coloured different from red

Mechanical damage

MD

Size and number of scars and bruises

Skin brightness

SB

Reflection of light from skin

Cross-section of the fruit

Cross-section colour uniformity

CSCU

Areas coloured different from red in the cross-section

Fruit compactness

FC

Appearance of cavities in the cross-section

Juice leakage

JL

Amount of juice leaked after cutting with knife

Vessels

V

Number of vessels seen in the cross-section

Skin peeling

SP

Amount of peel separated from mesocarp after cutting by knife

TEXTURE IN MOUTH

Firmness

FM

The force required to cut through the tomato sample using the front teeth.

Chewiness

CH

The length of time required to masticate the tomato to a state of swallowing.

Mealiness

M

Geometrical texture attribute relating to the perception of the size and shape of particle in the tomato sample

ODOUR

Odour

OD

Tomato characteristic odour

Off-odour

OOD

Non characteristic odour

TASTE

Sweet taste

ST

The fundamental taste associated with a sucrose solution

Off-taste

OFFT

Non characteristic taste

Conclusions

This research showed that the application of the multidimensional method can be suitable tool for identifying and selecting descriptors for establishing the sensory profile of the fresh tomato. These descriptors are useful for quality differentiation of tomatoes on the market, and determination of the optimal harvest maturity and storage conditions.

ACKNOWLEDGEMENTS

This paper is a result of the research within the project III 46001, financed by the Ministry of Education and Science, Republic of Serbia.


Download full article PDF

DOWNLOAD PDF


INSTITUTE
OF FOOD
TECHNOLOGY
IN NOVI SAD
www.fins.uns.ac.rs