
 JOURNAL TOOLS
DETERMINING THE YIELD STRESS OF FOOD PRODUCTS - IMPORTANCE AND SHORTCOMINGS
DOI:
UDK:
JOURNAL No:
Volume 35, Issue 3
PAGES
143-150
KEYWORDS
yield stress, food dressings, food spreads, vane, serrated plate


Tamara Dapčević1*, Petar Dokić1, Miroslav Hadnađev1, Milica Pojić1
1Institute for Food Technology, Novi Sad, Serbia
ABSTRACT
Abstract
Measurement of yield stress is important in ensuring the quality of various food products, as well as in determining the optimal processing and handling conditions. However, due to the complex nature of food products (three-dimensional network microstructure) there is a difficulty in choosing the most appropriate test by which the determined yield stress will be the true material physical property. Five different test methodologies, their advantages and disadvantages were discussed. The ways of overcoming some disadvantages were proposed. Controlled stress test was chosen as the most appropriate one in quality control. For qualitative comparison all tests can be used if defined properly.
INTRODUCTION
A large number of food products are in the form of soft solids or highly structured liquids, thus showing the properties of the yield stress materials.The most important characteristic of these materials is that they can behave as solids under small applied stresses, and as liquids at high stresses (Moller et al., 2006). The minimum stress required to make a material flow is called the yield stress (or yield point), and it is a measure of the strength of the material structure (Tárrega et al., 2006). In practice, that means that the yield stress material such as mayonnaise, ketchup, salad dressings etc. has to be handpumped from the tube in order to break down its structure and initiate its flow onto food. Since on the food there is no more stress or shear, and the material is left to rest over time, its structure rebuilds and it becomes solid again.
Because of the enormous range of applications the yield stress materials have been studied intensively in the last two decades. From 1985 when Barnes and Walters provocative article "The yield stress myth" (Barnes & Walters, 1985) showed up till 1999 when Barnes wrote a review of the yield stress, the phrases yield stress or yield point have been cited nearly 2500 times in the scientific and engineering literature (Barnes, 1999). During that period the subject of yield stress, its proper definition and even its existence were widely discussed. According to Barnes and Walters, as a physical property describing a critical stress below which no flow takes place, yield stress do not exist. The statement in some rheological books that everything flows if you wait long enough is very well known (Schramm, 2000). In the review from 1999 Barnes claimed that the conceptof a yield stress, when used and defined correctly, has proved very useful in a whole range of applications. According to Barnes the yield stress can be regarded as a critical stress for shearthinning, where below the critical stress the system has a viscosity plateau (Barnes, 1999).
Although, the concept of yield stress as a material physical property has been criticized, it was generally considered and used as important rheological criteria in food quality control, for product formulation, food processing design and optimization (Nguyen & Boger, 1992). Yield stress is also a key product characteristic which determines its texture, and thus the consumer sensory perception during use and application. It is very important, especially nowadays, when there are a lot of different producers of the same product. Generally, while choosing the product consumers are expressing a preference for the one with increasingly sophisticated performance. Everyone would rather choose thick and creamy sauce than the one which is thin and runny (Moonay, 2005).
However, the determination of a yield stress is a real challenge for the rheologists as the measured value is dependent on the measurement apparatus, geometry, experimental protocol and the model used to evaluate obtained data (Stokes & Telford, 2004). Also, the yield stress materials are typically thixotropic, which means that are dependent on the shear history of the sample and susceptible to ageing. According to Moller et al. (2006) the yield stress and thixotropy can be understood and modelled as two effects of the same cause.
The aim of this paper was to compare different tests for yield stress determination, and discuss them by presenting advantages as well as shortcomings of the each one. The measurements were performed using different commercial food dressings and spreads.
2. MATERIALS AND METHODS
For the yield stress measurements the following commercial food products were used: mayonnaise (Polimark, Serbia), ketchup (Polimark, Serbia), mustard with horse radish (Centroproizvod, Serbia) and chicken pâté (Argeta, Bosnia and Herzegovina).
The yield stress tests were carried out using Haake Mars rheometer (Thermo Scientific, Germany) equipped with three different geometries: plate/plate (diameter = 60mm), serrated plate/plate (diameter = 35mm) and 4-blade vane rotor (diameter = 22mm). The samples were stored at room temperature for 3 hours prior to measurement. In order to avoid destruction of the sample structure, they were carefully loaded, and smoothly brought to measuring position using the reduced lift speed of 0.6 mm/min. All measurements were performed at 20±0.1 °C using Haake Phoenix P1-C35P temperature circulator.
RESULTS AND DISCUSSION
For yield stress determination five different tests were employed: indirect (traditional) test, controlled stress test, controlled deformation test, oscillation stress sweep test and creep test. The mustard served as model system.
3.1. Indirect (traditional) tests
 Fig. 1. Flow curves for mustard sample as a function of shear time and shear rate range
The most common way for the yield stress determination is from a flow curve measured in a CR (controlled rate) mode (Fig. 1).
It involves the extrapolation of the shear stress (τ)–shear rate (ý) data to zero shear rate (start method) or calculation using the mathematical flow models such as Bingham, Casson – linear or non-linear form or Herschel-Bulkley. The models have the fo-llowing forms:
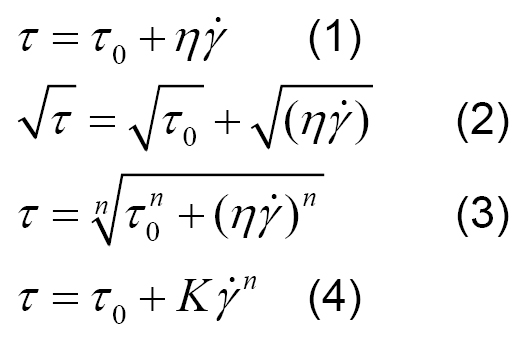 where: τ0 is the yield stress or yield point, η is the viscosity and K, n, are the parameters of flow equations. The selection of the ma-thematical equation, which will be used for fitting the data, depends on the shape of the experimentally obtained flow curve.
By indirect method, the yield stress is relatively easy and rapidly determined, but thus obtained yield stress value depends on the range of shear rate applied and on the time selected for the ramp (Fig. 1). How-ever, if a well defined procedure (tempe-rature, shear rate, shear time, measuring geometry) exists, the indirect method can produce very comparable results. One such example is OICCC standard used for tes-ting the liquid chocolate (OICCC, 1973).
3.2. CS (controlled stress) tests or shear stress ramps
For performing shear stress ramp method the CS rheometer mode has to be em-ployed.
 Fig. 2. Stress ramps of mustard obtained using a parallel-plate, serrated plate and vane measuring geometry
By plotting deformation (γ) versus shear stress (τ) in a double logarithmic scale, two regions with different slopes can be seen (Fig. 2)
The first one (smaller slope) is region of elastic deformation (solid like behaviour), while the second one (larger slop) is the region of viscous flow (liquid like beha-viour). The yield stress can be detected as a breakpoint in the slope of two power low regressions.
Shear stress ramps method is sensitive and provides reproducible results for both low and high yield stress materials (Kutsc-hmann, V98-156E). However, as all the methods it depends on the measuring geo-metry used (Fig. 2). Moreover, the wrong choice of geometry, results in incorrect yield stress determinations (Stokes & Telford, 2004). For example, measuring the yield point with smooth plate resulted in slip bet-ween sample and the plate. The resulted curve had two yield points. Slip can be avoided using the geometry with rough surface (e.g. serrated plate) or the vane rotor. The other advantages of the vane geometry, except the elimination of wall-slip effect, are its simplicity of fabrication, ease of cleaning and more than anything else, minimal destruction of the sample structure during loading (Barnes & Nguyen, 2001). Moreover, by direct inserting of vane into the actual product container the measurements can be performed with no disturbance of the material structure, what is especially important for the materials which exhibit thixo-tropic behaviour. The food technology groups in the USA headed by Steffe and Daubert (2000) even put an effort to make the vane method a national standard for determination of the yield stress of food.
The practical problems in using the vane are that it requires bigger amounts of sample than the plate geometry and that vanein-jar measurement are not always possible (sometimes the product are packed in tube or in jar having the unsuitable shape). Therefore the measurements done in this paper were recorded using the serrated plate geometry.
The stress ramps measurements can also be plotted as viscosity versus shear stress (Fig. 3). The yield stress is than determined using interpolation between the zero-shear viscosity and shearthinning region.
 Fig. 3. Viscosity vs. shear stress for mustard obtained using a parallel-plate, serrated plate and vane measuring geometry
The effect of time has been reported as the only shortcoming of the test performed in CS mode (Stokes & Telford, 2004). In this paper the influence of this effect was exa-mined by performing the measurements in which the time was ranging from 5 to 300s per applied stress (Fig. 4).
 Fig. 4. Stress ramps of mustard as a function of measurement duration time
The measured deformation increased with the time duration of the test, but this increase was not very noticeable. As it can be seen from the Fig. 4 the short duration tests (5s) are not favorable, while there is no sufficient time for structure to break down. The test performed using other time durations overlapped, indicating that the time factor has influence only if the time is too short or too long.
3.3. CD (controlled deformation) tests
The simplest method for yield point determination is the CD-test (Fig. 5), which can be carried out with a controlled rate rheo-meter. In this test constant, low shear rate is applied and the magnitude of shear stress is recorded for some period of time.
 Fig. 5. Determination of the yield stress of mustard by controlled deformation test as a function of the applied shear rate
The initial increase in stress represents the elastic response of the material, while a decrease of the stress value, indicates the gradual structure breakdown (Tárrega et al., 2006). This transition from viscoelastic to viscous flow is manifested as a peak in shear stress response which corresponds to the yield stress value. At low shear rate, the material is slow to respond and the stress increases to a relatively constant value. Using the higher shear rates, the peak in the stress occurs followed by stress decay towards a relatively constant stress values. Ideally, a shear rate should be used where a minimum in peak stress is observed, but this requires several tests to estblish and the test no longer becomes a quick determination of the yield stress (Stokes & Telford, 2004). The other drawback in using this test is that it is not sensitive enough for low yield stress materials (Kutschmann, V98-156E).
3.4. Oscillation stress sweep tests
Oscillation stress sweep measurements which serve for determination of the linear viscoelastic range of the product can also be employed for the yield stress determination. It involves monitoring the loss angle (δ) value with the shear stress at constant frequency (Fig. 6).
At small stress amplitudes the loss angle is independent of shear stress, while at the larger stresses, the increase in loss angle occurs, indicating viscous behaviour. The stress value at the transition from the visco-elastic to the viscous region represents the yield point (Petri, V96-127E).
 Fig. 6. Oscillation stress sweep of mustard as a function of the applied frequency
From the Fig. 6 it is clearly seen that the frequency value chosen do not significantly affect the results. However, it is worth to mention that the results obtained using stress sweep test, which belongs to the dynamic measurements, can be different from the other tests which are of static nature (Kutschmann, V98-156E).
3.5. Creep tests
Performing the series of creep tests is supposed to be the most accurate method for yield stress determination. One creep test involves monitoring of the response to an applied stress over a certain time period. Testing always a fresh sample under same conditions, but for different applied stresses, a series of curves are obtained (Fig. 7). The curves are identical to the moment when the yield stress is reached. At the yield stress the increase of the creep function occurs.
 Fig. 7. Series of creep tests performed with mustard
The yield point determined with creep test is lower that the yield point obtained from the other tests (Petri, V96-127E). Also, this method is very time consuming and its reproducibility is very hard to achieve because the sample preparation can affect the results.
Finally, the yield stress values of mustard as a model system, determined using the above described five methods are summarized in Table 1.
Table 1. Yield stresses of mustard determined using different tests
Test |
Experimental conditions |
Yield stress value (Pa) |
|
|
Indirect test |
Start method |
Ý max= 100s-1, t = 500s |
220 |
|
Bingham eq. |
Ý max= 100s-1, t = 100s |
205.5 |
|
|
Casson – linear eq. |
Ý max= 100s-1, t = 100s |
131.6 |
|
|
Casson – non-lin. eq. |
Ý max= 100s-1, t = 100s, n = 1/2 |
158.4 |
|
|
Herschel-Bulkley eq. |
Ý max= 100s-1, t = 100s, n = 1/2 |
148.9 |
|
|
CS test |
t = 150s |
200.6 |
|
|
CD test |
Ý max= 0.5s-1 |
201 |
|
|
Oscillation stress sweep test |
f = 1 Hz |
157.6 |
|
|
Creep test |
/ |
180 |
|
The result obtained using Bingham flow equation was similar to the results obtained using CS and CD test. The most commonly used methods in yield stress determination CS and CD tests produced the same results. The results obtained using extrapolation by Casson or Herschel-Bulkley equations and using oscillation stress sweep test were similar, although the methodology of these tests is very different. Results of creep test were right in the middle of the results obtained using other tests. Since this test is considered the most accurate, the value obtained using this test can maybe be the right one. However, having in mind that creep test produces lower values of the yield stress and that is very time con suming, it is not the appropriate one in quality control measurements.
CS test seemed to be the most appropriate method in quality control measurement, because it is quick, easy to perform and useful for wide range of yield stresses. With the usage of serrated, profiled or vane rotors it became reproducible.Therefore it was used for determining yield points of different food products. The obtained values are listed in Table 2.
Table 2. Yield stress values of different food products determined by CS test
Food product |
ketchup |
mayonnaise |
mustard |
chicken pâté |
|
Yield stress value (Pa) |
15.3 |
59.6 |
200.6 |
207.8 |
Ketchup and mayonnaise had lower yield stresses which indicate that these materials can be packed in tubes. However, while ketchup can also be packed in plastic bottles, the mayonnaise has to be packed in tubes that are easy to deform by hand-pumping. On contrary the consumers would not be able to empty container completely, which does not represent the problem only for the consumers, but for the recycling companies, too. On the other hand, mustard or pâté, having the high value of yield stress, have to be packed in plastic or metal tins. Otherwise, a big part of the product will stay in container, or the consumers will have much trouble in using it, which will result in rejecting of their further usage.
CONCLUSIONS
In this paper different methods for yield stress determination and their advantages and limitations were widely discussed. The main shortcomings of all the methods were the results dependence on the test conditions and sample shear history. Therefore, the operator has to be well informed about the material structure and its rheological properties. The usage of profiled geometries or vane rotor helps in obtaining more reliable results, and eliminates the mistakes ensued as a consequence of slippage. The CS test was chosen as the most appropriate yield stress test for food quality control. It was quick, accurate and could be performed easily, with a little amount of sample. The creep test, although the most accurate one, was very time consuming and every one creep test in the series required new, fresh sample, which enlarged the amount of sample required for the test performing. As the CS test, CD test was also accurate and easy to perform, but only if the appropriate shear rate was established. However, the operator needs to have in mind that CD test can be used only for the materials having yield stress value above 10Pa. Oscillation tests were very reproducible, but the obtained values were different from static tests. The extrapolation of the flow curve, although dependent on a wide range of conditions, could also be used if the conditions are well defined. However, for simple qualitative comparison of different product or the same product obtained using different conditions, all the methods could be used, but it is important to be consistent when comparing values of the yield stress.
ACKNOWLEDGEMENT
This research is a part of the project funded by Ministry of Science and Technological Development, Republic of Serbia, project no. 20066.