INTRODUCTION
Bakery products can be used for eliminating the deficit from some nutrition elements by applying nutritively valuable raw materials important for their chemical composition and biological value like sugar beet molasses etc. (Hickenbottom, 1996; Ranhorta, 1998; Šimurina et al., 2008; Kabiæ et al., 2008; Cvetkoviæ et al., 2009). In sugar industry, molasses represents the syrup obtained at the final level of crystallization (Šušiæ et al., 1989; 1995).
By its complex composition (bioactive substances – amino acids, vitamins, minerals), molasses is an exceptionally valuable material with a significant biological value. It is darkbrown syrup of high viscosity 6.5 – 8.0 Pas (at 40 °C) which contains around 50% of sucrose. Beside sugar, it also contains approximately 30% 35% of non sugars and 15 20% of water.
When we speak of non sugars, molasses contains around 10% of salts, among which potassium salts represent the major part. The rest of non sugars is consisted of organic substances which major part are organic nitrogen compounds. H. Claasen (Olbrich, 1963) provided the definition of theoretical and practical molasses. According to him, the theoretical definition of molasses implies liquid mixture of sugars, non sugars and water out of which in favourable conditions and in a longer period it is not possible to obtain sucrose in the form of relatively pure crystals. Under practical molasses, he implies the final syrup out of which in favourable technical conditions and in the process of further concentration by cooking it is not possible to obtain such share of sucrose that its production becomes economically justified (Šušiæ et al., 1989).
By addition of sugar beet molasses into bread, the bread becomes enriched with B-complex vitamins, minerals of potassium, sodium, magnesium and oligoelements. Molasses content in the quantity of 3 g to 100 g of bread increases potassium content for 67%, calcium for 37%, sodium for 4%, iron for 5%, with magnesium being intaked as well. Specific aroma and sweet taste limit its quantity in bread dough within limits ranging from 3 to 5 g in 100 g of the product (Pribiš et al., 2008).
Previous research work showed that molasses decreases bread volume and increases crumb hardness, especially at higher doses (15% flour basis) (Leviæ et al. 2005; 2006).
They generally observed reduction in loaf volume and impairment of sensory qualities (e.g. appearance, texture and flavor) as the level of substitution of wheat with sugar beet molasses increased (Živkoviæ et al., 2007; Pestoriæ et al., 2008).
In order to ameliorate these undesirable effects of molasses, natural dough and bread improvers were applied: vital wheat gluten and flax seed.
Vital wheat gluten, a by product of wheat starch extraction process, is characterized by high protein content (75-85% dry basis) and good viscoelastic properties (Stenvert et al., 1981). The addition of vital gluten increases dough stability, improves gas retention (Hoseney 1984), loaf volume, crumb grain, texture, softness and shelf life (Stenvert et al. 1981; Wiepert and Zwingelberg, 1992).
Flaxseed is nowdays increasingly applied in human nutrition and in the production of functional food and bakery goods due to its nutritive and health value (Payne, 2000; Mišan, 2010). Besides, flaxseed is important from technological point of view due to large quantity of pentosans (7 9%) and dietary fibers (24.5%), both soluble and insoluble ones (Lagrange, 1995). It is known that pentosans have a great capacity of water absorption. Due to that reason they influence the improvement of rheological dough capacities, the increase of volume and preserving of bakery goods freshness (Kulp, 1963; Neukom et al., 1967b). On the addition of flaxseed (816% basis on flour), it can be achieved an increase in bread volume, improvement of crumb quality (more elastic and very fine pore structure), aroma, taste and crumb and crust mastication of bakery goods (Bojat et al., 2000; Torbica et al., 2008). Because of the mentioned positive effects, in the bread with molasses, flax seed was applied at doses 4, 6 and 8%, flour basis.
Response surface methodology (RSM) is a statistical technique that has been successfully applied in the development and optimazation of cereal products (Ylimaki et al 1988; Toufeili et al., 1994; Gallagher et al., 2003b). The relative contribution of predictor variables to product characteristics is evaluated and allows optimum ingredient levels to be determined (Crowley et al., 2001).
The objective of the current study was to develop an optimized formulation of the specialty bread containing sugar beet molasses, flax seed and vital wheat gluten using RSM. The present study was designned: (1) to establish factors (sugarbeet molasses, vital gluten and flex seed) affecting bread quality and (2) to determine optimal levels of these ingredients for maximum bread quality, especially to improve the specific volume and reduce crumb hardness.
MATERIALS AND METHODS
Commercially refined wheat flour with the following characteristics was used: 13.1 g/100 g water content, 0.52 g/100 g d.b. (dry basis) ash content, 11.3 g/100 g d.b. protein content. Moisture, crude protein, crude ash of flour were determined according to standard ICC procedures (ICC, 2001).
Characteristics of applied sugar beet molasses is shown in Table 1. Chemical analyses of sugar beet molasses were performed according to AOAC methods (AOAC, 1984). pH value of molasses was determined by potentiometric method in watermolasses solution (1:1) using pH meter. Mineral content of molasses was determined by atomic absorption spectrometry with an atomic spectrometer “Varian” model “Spectra 10” Vital gluten was applied with the following characteristics: moisture 8.06%, crude protein (Nx6.25) 82.17%, crude fat 2.21%, ash content 0.87%.
Reddishbrown flax seed of domestic origin was used with the following chemical composition: protein content 26.7% d.m., oil content 42.5%d.m., pentosans content 8.0% d.m. Flax kernels before the dough mixing were prepared by soaking with the addition of two times more water quantity at the temperature of 40 °C during minimally an hour.
Baking tests were performed under laboratory conditions using rapid mixing procedure. The ingredients used (calculated on 100% wheat flour) for the basic wheat dough were: flour (100%), fresh yeast (5%), sugar (1%), salt (2%), fat (1%) and water according to farinograph water absorption (FWA) (ICC standard No. 115) (ICC, 2001). Sugar beet molasses, vital wheat gluten and flax seed were added according to the experimental plan shown in Table 2 and 3. Dough preparation and baking were done according to a method described in detail in the work of Filipèev et al. (2010).
Evaluation of bread quality
Quality analysis of fresh bread samples was carried out by measuring weight, volume (determined by seed displacement in a loaf volume meter) and specific volume. Specific volume was calculated as the ratio of volume and mass. Bread texture attributes were evaluated 24 h after baking on a texture analyzer by applying ‘‘Texture Profile Analysis’’ (TPA).
An aluminium 25 mm diameter cylindrical probe was used. Slices of 2 cm thickness were compressed to 60% of their original height in a double compression test, at 0.5 mm/s speed test, with a 75 s delay between first and second compression. Parameters (hardness (gramforce, gf), springiness and cohesiveness) were collected from the TPA graphic.
Table 1. Chemical composition and characteristics of sugar beet molasses
| Saccharose content, % |
52,32
|
|
Water content, %
|
14,96
|
|
Ash content, % d.b.
|
17,91
|
|
pH value
|
8,45
|
|
NaCl, %
|
0,01
|
|
K, mg/kg
|
21102,11
|
|
Na, mg/kg
|
1178,40
|
|
Mg, mg/kg
|
260,92
|
|
Fe, mg/kg
|
102,12
|
|
Ca, mg/kg
|
2110,17
|
Sensory evaluation
Descriptive analysis was used to determine the flavor of the bread samples. The acceptance of flavor impression as a combination of odor, taste and their overall roundness was evaluated. The attribute intensities were rated on intensity scales (19); dislike extremely (value 1) and like extremely (value 9). A fivemember expert panel, specialized in cereal products, described the differences between the breads in a roundtable session.
Crumb and crust color
The color of bread was directly measured with a Konica Minolta Chroma Meter CR400, using Light Protection Tube CRA33f, for measurement of soft samples. The CIE L* (lightness), CIE a* (redgreen) and CIE b* (yellowblue) were read using a D65 light source with the observer angle at 2 °C. Each sample was measured on three differrent locations.
Experimental design and statistical methods
Response surface methodology (RSM) was used to study the simultaneous effects of sugar beet molasses, flax seed and vital wheat gluten addition on specialty bread. After preliminary baking tests, the upper and lower limits for these variables were established (Bojat et al., 1995; 2000; Šimurina et al., 2008; Filipèev, 2011)
An incomplete 33 factorial design and three replicates at the central point were used to investigate the effect of three independent variables on the physical and sensory properties of the specialty bread (Table 2) (Box and Benhken, 1960). The independent variables, sugar beet molasses concentration (SBM), flax seed concentration (FS) and vital wheat gluten concentration (VWG) were assessed at three equidistant levels of variation. For each response (specific volume (SV), hardness (HD), springiness (SP), cohesiveness (COH)) a quadratic model was used (eqn. 1):
Y= b0+ b1X1 +b2X2 +b3X3 +b11X12 +b22X22 + b33X32 + b12X1X2 + B13X1X3 +B23X2X3 (1)
Where Y is the response function of the experimental data, X1, X2 and X3 are the independent variables, and the b parameters are the estimated coefficients. The adequacy of the model was evaluated by coefficient of determination, R2, F-value and model p-value at the 0.1 significance.
The significance of regression coefficients was assessed by pvalues at the 0.1 significance level. Plotting responses as a function of two factors drew response surface plots, but the third factor was set to its medium value.
Numerical optimization was based on the desirability function D = (d1 x d2 x d3……xdn)1/n where di are the desirability indices for each response (di = 0 least desirable; di = 1 most desirable) and n is the number of responses in the measure (Derringer and Suich, 1980). Optimization was based on the +1, 0 and –1 variable levels of the experimental design (Table 2 and Table 3). RSM was performed with DesignExpert 8.1 (StatEase Corporation, Minneapolis, MN, USA). The desirability function approach (DFA) was used to simultaneously optimize specific volume and hardness of the specialty bread. Table 6 shows conditions of the optimization process.
Table 2. Real and coded values of independent variables used for experimental design
|
|
Independent variables
|
Coded values
|
|
|
-1
|
0
|
+1
|
|
Real values
|
Sugar beet molasses, g/100g flour
|
5
|
10
|
15
|
|
Flax seed, g/100g flour
|
4
|
6
|
8
|
|
Vital wheat gluten, g/100g flour
|
0
|
2
|
4
|
RESULTS AND DISCUSSION
Experimental design results and response surface analysis
Results of the experimental design to Specific volume (SV), hardness (HRD), springiness (SP) and cohesiveness (COH) of the specialty bread with different concentration of sugar beet molasses (SBM), flax seed (FS) and vital wheat gluten (VWG) are shown in Table 3. These responses ranged from 2.7% to 4.4% to SV, 953.27gf to 3990.16gf to HRD, 0.73 to 0.92 to SP and 0.35 to 0.54 to COH.
Table 3 shows regression coefficients (b) for the independent variables (sugar beet molasses concentration, flax seed concentration and vital wheat concentration), interactions upon response variables, the Ftest and the determination coefficient (R2). The significant terms (P ? 0.1) were used to propose models for each response which were tested for adequacy and fitness using the ANOVA. For these responses, the Ftest was higher than Flisted, and the models presented high values of determination coefficient (R2 > 0.85; Table 4).
Table 3. Experimental design and obtained results
Run |
SBM (%)
|
FS (%)
|
VWG (%)
|
SV (ml/g)
|
HRD (gf)
|
SP
|
COH
|
|
1
|
1
|
0
|
1
|
4.2
|
1361.16
|
0.91
|
0.54
|
|
2
|
1
|
0
|
1
|
4.4
|
953.27
|
0.92
|
0.53
|
|
3
|
1
|
0
|
1
|
2.7
|
3990.16
|
0.65
|
0.35
|
|
4
|
1
|
0
|
1
|
3.1
|
2798.61
|
0.75
|
0.37
|
|
5
|
0
|
1
|
1
|
3.9
|
1346.77
|
0.90
|
0.47
|
|
6
|
0
|
1
|
1
|
3.9
|
1488.46
|
0.89
|
0.49
|
|
7
|
0
|
1
|
1
|
3.8
|
2234.09
|
0.81
|
0.46
|
|
8
|
0
|
1
|
1
|
3.8
|
1761.48
|
0.87
|
0.46
|
|
9
|
1
|
1
|
0
|
4.2
|
1274.98
|
0.90
|
0.51
|
|
10
|
1
|
1
|
0
|
3.2
|
2596.09
|
0.76
|
0.39
|
|
11
|
1
|
1
|
0
|
4.6
|
1323.82
|
0.86
|
0.52
|
|
12
|
1
|
1
|
0
|
3.0
|
3369.62
|
0.73
|
0.37
|
|
13
|
0
|
0
|
0
|
3.8
|
1891.58
|
0.87
|
0.46
|
|
14
|
0
|
0
|
0
|
3.8
|
1995.43
|
0.83
|
0.47
|
|
15
|
0
|
0
|
0
|
3.8
|
2135.71
|
0.86
|
0.45
|
Table 4. Regression coefficients for specific volume (SV), hardness (HRD), springiness (SP) and cohesiveness (COH) of the specialty bread formulation containing sugar beet molasses, flax seed and vital wheat gluten
Coefficient |
SV (ml/g)
|
HRD (gf)
|
SP
|
COH
|
|
Intercept (b0)
|
4.525
|
855.221
|
1.043
|
0.596
|
|
Vital wheat gluten (VWG) (b1)
|
0.037
|
388.223*
|
0.041
|
0.003
|
|
Sugar beet molasses (SBM) (b2)
|
0.065*
|
154.149*
|
0.017*
|
0.002*
|
|
Flax seed (FS) (b3)
|
0.150
|
671.349*
|
0.041*
|
0.020
|
|
VWG2 (b11)
|
0.006*
|
20.649
|
0.000
|
0.001
|
|
SBM2 (b22)
|
0.012*
|
14.033*
|
0.002*
|
0.001*
|
|
FS2 (b33)
|
0.025
|
54.317
|
0.017*
|
0.002
|
|
VWG x SBM (b12)
|
0.005*
|
19.591
|
0.002
|
0.000
|
|
VWG x FS (b13)
|
0.000
|
38.393
|
0.004
|
0.001
|
|
SBM x FS (b23)
|
0.015
|
18.117
|
0.000
|
0.001
|
|
R2
|
0.983
|
0.961
|
0.945
|
0.979
|
|
F test
|
31.17
|
13.58
|
9.60
|
25.71
|
|
F listed
|
4.735
|
4.735
|
4.735
|
4.735
|
*Statistically significant values (P?0.1)
 |
 |
|
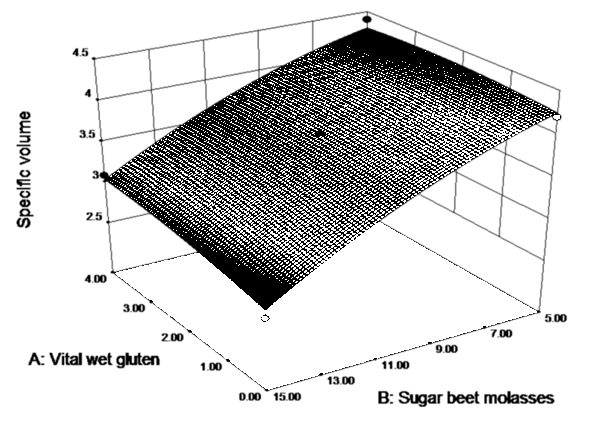
Figure1. Influence of sugar beet molasses and vital wheat gluten on specific volume of specialty bread at constant flax seed concentration
|
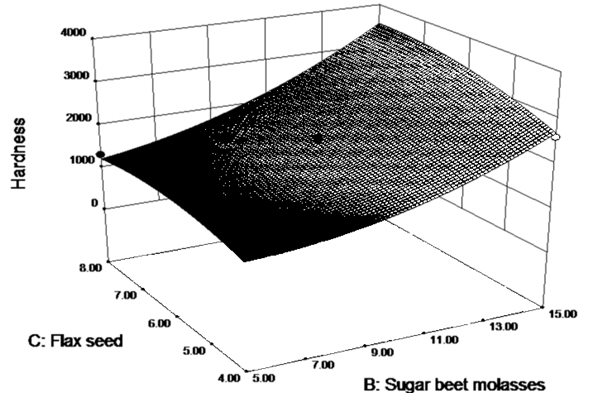
Figure 2. Influence of sugar beet molasses and flax seed on bread crumb hardness of specialty bread at constant vital wheat gluten concentration
|
 |
 |
|
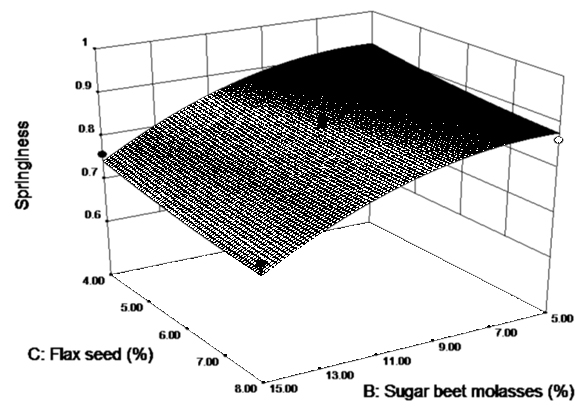
Figure 3. Influence of sugar beet molasses and flax seed on bread crumb springiness of specialty bread at constant vital wheat gluten concentration
|
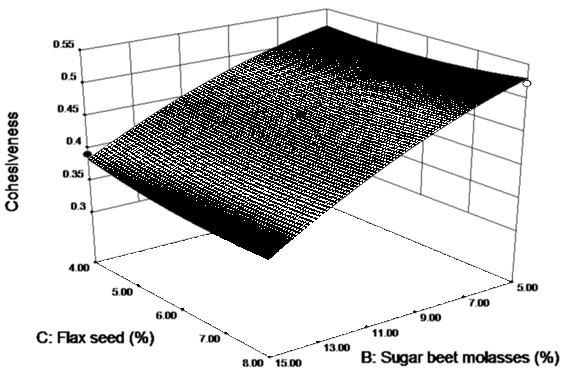
Figure 4. Influence of sugar beet molasses and flax seed on bread crumb cohesiveness of specialty bread at constant vital wheat gluten concentration
|
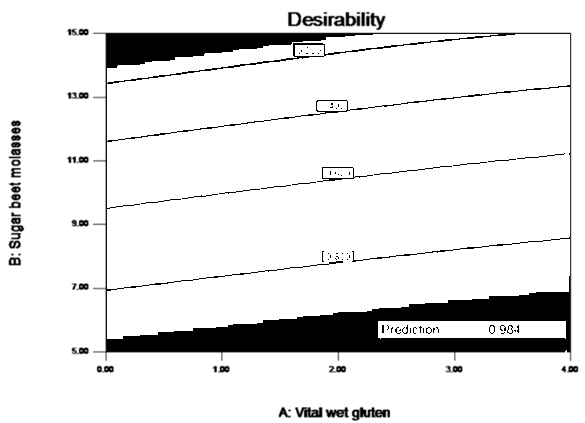 |
 |
|
Figure 5. Dependence of overall desirability function from dose of sugar beet molasses and vital wheat gluten in specialty bread at constant flax seed concentration
|
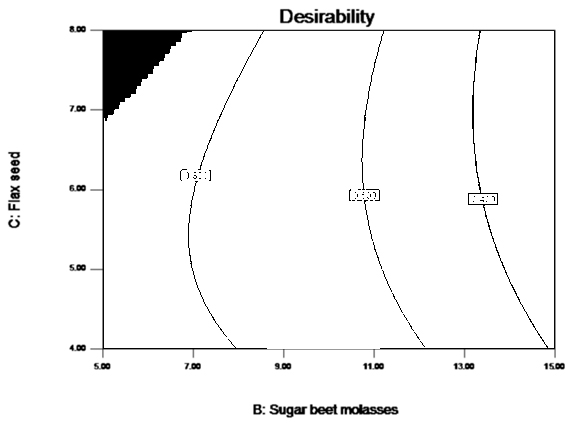
Figure 6. Dependence of overall desirability function from dose of sugar beet molasses and flax
|
To establish predictive models for the bread properties from the varying concentrations of sugar beet molasses, vital wheat gluten and flax seed the experimental data for each response variable were fitted to the second order polynomial models (described by eqns 2–5). Polynomial models included only values of significant coefficients (90% confi-dence level).
SV = 4,525 + 0,065SBM + 0,005SBM*VWG - 0,012 SBM2 + 0,006 VWG2 (2)
HRD = -855,221 + 388,223VWG – 154,149SBM - 671,349FS +14,033SBM2 (3)
SP = 1,043 + 0,017SBM – 0,041FS-0,002SBM2 + 0,017FS2 (4)
COH = 0,596 + 0,002SBM – 0,001SBM2 (5)
On the basis of results in Table 4, all models had a coe?cient of determination (R2) higher than 0.94, showing that more than 94% of the total variations around the mean values, provoked by the experimental conditions. The effect of molasses and vital gluten on the specific volume of breads is shown in Fig. 1.
The specific volume has been generally adopted in the literature as a more reliable measure of loaf size. Molasses significantly affects (p<0,1%) bread specific volume and by quadratic increase of its dose, specific volume significantly decreases. However, increasing gluten concentration significantly increases bread volume which led to positive interaction effect between molasses and wheat gluten (+0,005SBM*VWG). The addition of flax seed did not considerably affect bread volume.
All three ingredients at their initial doses significantly affect bread crumb hardness. At the tested dose interval, vital wheat gluten significantly increases crumb hardness but the quadratic effect of vital gluten dose reduces crumb hardness (although not significantly). Molasses is an important ingredient that affects bread crumb structure: at low doses, molasses softens crumb whereas at quadratic dose increase, it hardens the bread crumb (Figure 2). This is probably owing to its composition i.e. high saccharose content 52.32%. It is known that saccharose at 5% dose positively affects the textural properties of bread crumb whereas higher doses generally produces negative effect on bread quality (Colliery, 1967; Payer, 1973). Flax seed decreases crumb hardness at the tested doses (48%) whereas quadratic effect does not have further significant effect (Figure 2).
Bread crumb springiness is significantly affected by doses of molasses and flax seed (Figure 3). At lower doses, molasses improves crumb springiness whereas with quadratic dose increase, molasses decreeses crumb springiness. Flax seed produces effects on bread crumb opposite to those of molasses. Positive effect of flax seed on crumb springiness is due to its high content of soluble and insoluble pentosans (Lagrange, 1995; Payne, 2000). Pentosans play a significant role in maintaining balance of water adsorption among components of flour, increase development time, resistance and stability of dough, representing at the same time dough and bread improvers (Neukom et al., 1967a; 1967b; Kulp et al.,1963; Kulp 1968).
Bread crumb cohesiveness was affected only by molasses and its action depends on the dose. At lower applied doses (5%-10%), the intensity of internal bonds increases in bread crumb whereas crumb stability decreases with quadratic increase in molasses dose. The addition of molasses conveys saccharose into bread which lowers crumb cohesiveness. This harmonizes with the findings of (Collyer,1967) who concluded that higher saccharose doses affect the consistency of baked products by reducing crumb cohesiveness.
Colour and sensory properties evaluation
Previous works have shown that instrumental measurement of baked products’ colour is an inevitable quality check that could be used in determining the effects of ingredient or product formulation on baked products (Erkan et al., 2006; Gallagher et al., 2003a, Gallagher et al., 2003b; Sanchez et al., 1995). Most of these works reported the tristimulus CIELAB color parameters (L*, a*, b*) for the respective products’ crust and crumb.
By addition of the investigated components, we significantly changed the sensory characteristics of bread which are primarily reflected through colour and aroma. The effects obtained by sugar beet molasses, flax and vital wheat gluten are shown in Table 5 through regression coefficient values for L*, a* i b* crust and crumb values and aroma of bread. Molasses concentration of 5% to 10% added into flour has a significant effect upon decreasing of crust and crumb brightness, wherein this effect is more visible in crumb. With square increase of molasses concentration, the effect has no significant changes in relation to the obtained one with initial concentrations. Also, sugar beet molasses significantly increases the presence of red tone in crust and crumb bread color. The increase of the red tone is also significantly influenced by flax seed added into flour inconcentrations ranging from 4% to 8%.
Square increase of the mentioned raw materials has no significant changes in the red tone of crust, whereas in the crumb there is present an increasing tendency.
Molasses also contributes to the significant appearance of yellow tone in crumb, while this effect is not present in crumb even with much higher concentrations. Such an outstanding presence of red and yellow tone in crust, actually bread crumb represents the consequence of the content of reductive sugars which are input by molasses and colored products of Maillard reaction (Pribiš et al., 2008).
Table 5. The effects of factors on sensory properties of the specialty bread formulation containing sugar beet molasses, flax seed and vital wheat gluten
|
Factors
|
Regression coefficients
|
|
Color crust
|
Color crumb
|
Flavor
|
|
L*
|
a*
|
b*
|
L*
|
a*
|
b*
|
|
|
Intercept (b0)
|
61.32
|
18.79
|
41.87
|
62.00
|
3.80
|
ns
|
4.17
|
|
Vital weat gluten (VWG) (b1)
|
*ns
|
ns
|
ns
|
ns
|
ns
|
ns
|
ns
|
|
Sugar beet molasses (SBM) (b2)
|
4.965
|
0.957
|
5.55
|
6.332
|
0.745
|
ns
|
0.225
|
|
Flax seed (FS) (b3)
|
ns
|
0.949
|
ns
|
ns
|
0.894
|
ns
|
ns
|
|
VWG2 (b11)
|
ns
|
0.355
|
0.692
|
ns
|
0.031
|
ns
|
ns
|
|
SBM2 (b22)
|
ns
|
ns
|
0.203
|
ns
|
0.025
|
ns
|
0.382
|
|
FS2 (b33)
|
ns
|
ns
|
ns
|
ns
|
0.081
|
ns
|
ns
|
|
VWG x SBM (b12)
|
ns
|
0.020
|
0.037
|
ns
|
0.428
|
0.137
|
ns
|
|
VWG x FS (b13)
|
ns
|
ns
|
0.688
|
ns
|
0.038
|
ns
|
ns
|
|
SBM x FS (b23)
|
ns
|
0.364
|
ns
|
ns
|
0.022
|
ns
|
0.435
|
Table 6. Conditions and obtained results of the optimization process to maximize specific volume and and minimize hardness of specialty bread with sugar beet molasses, flax seed and vital wheat gluten
Factors and responses |
Goal
|
Lower limit
|
Upper limit
|
Importance
|
Optimum
|
|
Vital wheat gluten
(g/100g flour)
|
in range
|
0
|
4
|
3
|
3.96
|
|
Sugar beet molasses (g/100g flour)
|
in range
|
5
|
15
|
3
|
5.00
|
|
Flax seed
(g/100g flour)
|
in range
|
4
|
8
|
3
|
8.00
|
|
Spec Volume (ml/g)
|
MAX
|
2.7
|
4.6
|
5
|
4.5
|
|
Hardness (gf)
|
MIN
|
953.3
|
3990.1
|
3
|
953.2
|
Vital wheat gluten added into flour in the concentration up to 4% has no significant influence upon crust and crumb bread colour. With square increase of its concentration there occurrs a significant decrease in the red tone.
This characteristic of vital wheat gluten contributes to the so called ’dillution’ of the red and yellow tone in bread with molasses, i.e. to the effect of the decreasing of their value.
Process optimisation through the desirability function
In Table 6, conditions of the optimization process to maximize specific volume and minimize hardness in the specialty bread are displayed. The selection of bread quality attributes (responses) in the optimization process and their relative importance was based on literature data and consumer preference (Pestoriæ et al., 2011). The simultaneous evaluation of the experimental design responses resulted in the overall desirability pro?le shown in Figure 5 and 6.
By applying the desirability function, the optimum concentrations were sugar beet molasses 5%, flax seed 8% and vital wheat gluten 3.96% on flour, with a desirability value of 0.984. At these concentrations, maximum specific volume and minimum hardness were obtained, showing predicted values of 4.55 ml/g and 953.255 gf, respectively.
CONCLUSIONS
Upon the analysis of the presented results, the application of natural ingredients like flax seed and vital wheat gluten to improve the quality of specialty bread enriched with molasses seems to be justified. Vital wheat gluten produced significant positive effect on bread specific volume and flax seed improved crumb elasticity and lowered bread crumb hardness. Intensity of these effects was dose dependent. Regression model developed can be used to predict the loaf specific volume, bread crumb hardness, bread crumb springiness and bread crumb cohesiveness. The final result of optimazation suggested that the optimal ingredient doses to achieve bread with maximal volume and minimal crumb hardness amounted to 3.96% for vital gluten, 8% for flax seed and 5% for molasses. The estimated values of specific volume and crumb hardness in optimally formulated bread were 4.55 ml/g for specific volume and 953.25 gf for hardness.
The colour of bread crumb and crust is entirely under the influence of sugar beet molasses. The other two components (flax seed and vital wheat gluten) have no statistically significant effect upon bread brightness. The addition of of vital wheat gluten in high concentrations significantly influences the decreasing of the red and yellow tone in bread with sugar beet molasses.
ACKNOWLEDGEMENTS
This paper is a result of the research within the project TR 031055 financed by the Ministry of Education and Science, Republic of Serbia.
Download full article PDF
 DOWNLOAD PDF


