NONLINEAR MODELS FOR PREDICTING METABOLIZABLE ENERGY OF POULTRY DIETS
metabolizable energy, mathematical model, regression analysis, poultry, diets


*This paper is a result of the research within the project III046012 financed by the Ministry of Science and Technological Development, Republic of Serbia. This study was also supported by the Ministry of Agriculture, Republic of South Africa.
ABSTRACT
ABSTRACT
Introduction
MATERIAL AND METHODS
Chemical analysis
Experimental design and statistical analysis
Results and Discussion
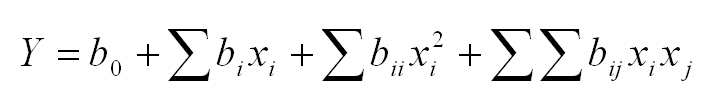
The six polynomial equations are proposed in this study. Each equation is describing individual and interaction effects of three factors on the TMEn. In vitro digestibility was taken into account in all equations. Regression equation coefficients are presented in Table 3. Subscript numbers of the coefficients are denoting factors to whom they are related. The significance of the coefficients is evaluated by Student’s t-test and p-values. Bold numbers denote values significant at 95% level.
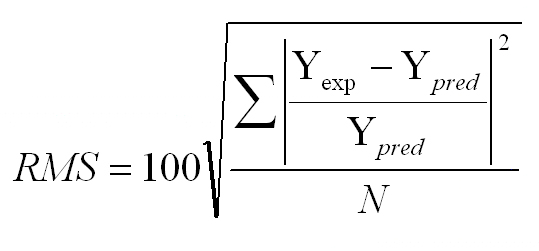
Equation 1 (in vitro digestibility, crude protein and crude fat) shows that linear and quadratic effect of in vitro digestibility on TMEn is significant (p ≤ 0,05). Equations 2 (in vitro digestibility, crude protein and crude fibre) and 3 (in vitro digestibility, crude protein and crude fibre) are not having significant regression coefficients. All three equations are having relatively low coefficient of determination (R2 < 0,8). Equation 4 (in vitro digestibility, crude fat and crude fibre) indicated that linear and quadratic influence of crude fat and crude fibre was significant, as well as the interaction of all three factors. Obtained coefficient of determination was relatively higher in comparison with equations 1, 2 and 3. Equation 5 (in vitro digestibility, crude fat and ash) is showing significant linear and quadratic influence of in vitro digestibility, with high coefficient of determination (R2 = 0,93). Linear and quadratic influence of in vitro digestibility in equation 6 (in vitro digestibility, crude fibre and ash), likewise in equations 1 and 5, was significant.
Coefficient of determination of equation 6 was R2 = 0,87. The EDOM and TMEn values of complete poultry diets are shown in Table 2.
Diet |
Dry matter (%) |
Crude protein |
Crude fat |
Crude fibre |
Crude ash |
|
1 |
89,85 |
27,37 |
11,06 |
3,58 |
8,29 |
|
2 |
89,59 |
21,79 |
7,50 |
2,98 |
7,03 |
|
3 |
88,90 |
16,63 |
11,06 |
4,09 |
6,43 |
|
4 |
89,84 |
20,78 |
14,88 |
3,68 |
7,35 |
|
5 |
89,57 |
17,19 |
9,74 |
7,25 |
11,39 |
|
6 |
89,31 |
21,88 |
9,56 |
8,87 |
7,02 |
|
7 |
85,30 |
24,72 |
9,50 |
2,73 |
4,28 |
|
8 |
86,35 |
25,99 |
5,72 |
2,78 |
3,81 |
|
9 |
88,68 |
25,01 |
3,17 |
2,12 |
5,86 |
|
10 |
88,31 |
24,61 |
6,08 |
2,65 |
5,42 |
|
11 |
88,77 |
25,38 |
3,56 |
2,49 |
6,08 |
|
12 |
87,99 |
24,65 |
8,82 |
2,38 |
5,21 |
|
13 |
88,50 |
22,35 |
5,51 |
2,11 |
5,22 |
|
14 |
88,43 |
19,97 |
7,50 |
4,24 |
5,48 |
|
15 |
88,26 |
21,40 |
4,32 |
2,06 |
5,94 |
|
16 |
88,25 |
22,66 |
7,37 |
2,16 |
6,06 |
|
17 |
88,28 |
26,22 |
2,91 |
3,05 |
6,21 |
|
18 |
88,06 |
26,39 |
3,21 |
1,90 |
5,32 |
|
19 |
88,21 |
26,53 |
3,16 |
2,69 |
5,63 |
|
20 |
88,16 |
25,84 |
2,89 |
4,07 |
5,57 |
|
21 |
88,23 |
26,77 |
2,79 |
2,57 |
2,25 |
Diet |
EDOM (%) |
TMEn (MJ/kg DM) |
|
1 |
84,01 |
14,63 |
|
2 |
84,94 |
14,59 |
|
3 |
83,31 |
16,92 |
|
4 |
83,78 |
16,50 |
|
5 |
71,50 |
12,60 |
|
6 |
75,27 |
15,28 |
|
7 |
81,60 |
17,18 |
|
8 |
86,76 |
15,81 |
|
9 |
81,94 |
15,28 |
|
10 |
80,29 |
16,46 |
|
11 |
81,47 |
15,21 |
|
12 |
81,83 |
16,51 |
|
13 |
80,75 |
16,33 |
|
14 |
78,61 |
15,67 |
|
15 |
79,20 |
15,99 |
|
16 |
82,68 |
16,19 |
|
17 |
77,85 |
14,71 |
|
18 |
79,65 |
15,46 |
|
19 |
78,60 |
15,38 |
|
20 |
78,30 |
14,92 |
|
21 |
78,57 |
15,46 |
DM – dry matter
Eq 1 |
Eq 2 |
Eq 3 |
Eq 4 |
Eq 5 |
Eq 6 |
||||||||
|
b0 |
-348,210 |
b0 |
-204,868 |
b0 |
-189,923 |
b0 |
297,747 |
b0 |
-330,648 |
b0 |
-645,942 |
||
|
Linear |
|||||||||||||
|
b1 |
8,848 |
b1 |
5,453 |
b1 |
5,177 |
b1 |
-6,477 |
b1 |
8,274 |
b1 |
16,183 |
||
|
b2 |
-0,301 |
b2 |
0,473 |
b2 |
-0,349 |
b3 |
15,586 |
b3 |
0,467 |
b4 |
-14,945 |
||
|
b3 |
2,249 |
b4 |
-4,944 |
b3 |
0,368 |
b4 |
-39,663 |
b5 |
3,845 |
b5 |
7,693 |
||
|
Quadratic |
|||||||||||||
|
b11 |
-0,058 |
b11 |
-0,036 |
b11 |
-0,032 |
b11 |
0,037 |
b11 |
-0,049 |
b11 |
-0,098 |
||
|
b22 |
-0,029 |
b22 |
-0,019 |
b22 |
-0,001 |
b33 |
0,055 |
b33 |
0,004 |
b44 |
0,165 |
||
|
b33 |
-0,039 |
b44 |
0,081 |
b55 |
0,007 |
b44 |
0,416 |
b55 |
3,845 |
b55 |
0,004 |
||
|
Interaction |
|||||||||||||
|
b12 |
0,027 |
b12 |
0,007 |
b12 |
0,004 |
b13 |
-0,188 |
b13 |
-0,003 |
b14 |
0,165 |
||
|
b13 |
0,003 |
b14 |
0,078 |
b15 |
-0,007 |
b14 |
0,478 |
b15 |
-0,052 |
b15 |
-0,109 |
||
|
b23 |
-0,074 |
b24 |
-0,082 |
b25 |
-0,011 |
b34 |
-0,278 |
b35 |
-0,016 |
b45 |
0,240 |
||
|
R2 |
0,77 |
R2 |
0,68 |
R2 |
0,79 |
R2 |
0,86 |
R2 |
0,93 |
R2 |
0,87 |
||
|
RMS |
2,98 |
RMS |
3,45 |
RMS |
2,80 |
RMS |
2,22 |
RMS |
266,36 |
RMS |
2,10 |
||
Eq – equation