ABSTRACT
Abstract
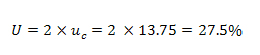
An adequate and verified method for the analysis of any nutrient is a fundamental step in achieving a good analytical result. The aim of this study was to test suitability of the method for total oil content determination in different cereal products. Fifty six samples of cereal products were analyzed in duplicate using AOAC Official Method 945.16. For method verification, corn flour and corn grits were used as a matrix food and as secondary reference standards (SRS). Evaluation of different verification parameters was conducted. Repeatability and reproducibility precision values, determined using corn flour sample were lower than values calculated using the Horwitz equation, indicating satisfactory precision. Results obtained from inter-laboratory comparison testing provided z-score of -0.19 which indicates acceptable reproducibility, since z<|2|. Detection and quantification limits were determined from blank sample analysis and had values of 0.006% and 0.02%, respectively. Warning and action limits were determined from analysis of secondary reference standards and showed a good stability of the method. Method ruggedness was examined by comparison of the results obtained using two different instruments (Soxhet Extractor and Total Fat Determinator). Student’s test gave a value of t=1.11 and p=0.279, assuring good congruence between two instruments. Measurement uncertainty, expressed as expanded uncertainty, was estimated from verification data (U=27.5%).
INTRODUCTION
Humans have been consuming grain foods for at least 10 000 years. Grain foods, which include cereal products, are dietary staples for many cultures around the world, and provide around one fifth of daily nutrient requirements. Current research around the world have been discovering the numerous and varied health benefits that cereal foods can offer, particularly in reducing the risk of diseases, such as coronary heart disease, cancer and diabetes (La Vecchia, Chatenoud, Negri, & Franceschi, 2003). Cereal products provide a rich source of many essential vitamins, minerals and phytochemicals. The typical cereal food is low in saturated fat but is a source of polyunsatured fats, including omega 3 linolenic acid (Wahlqvist, 2002). Method for determination of total oil content is important for determining shelf-life of cereal based food, and represents a necessary step in assessing nutritional value of these products. Introduction of a new analytical method into the laboratory requires previous validation, as the first level of quality assurance. When the method has been previously validated according to an international protocol, the laboratory does not need to conduct extensive in-house validation studies. It must verify only that it can achieve the same performance characterristics as outlined in the collaborative study (Taverniers, De Loose, & Van Bockstaele, 2004).
The aim of this study was to evaluate the parameters which can ensure valid and accurate analytical results for determination of total oil content in cereal products. Different parameters were evaluated, among them repeatability, within-laboratory and inter-laboratory precision, detection and quantification limits along with warning and action limits, method ruggedness and measurement uncertainty.
MATERIALS AND METHODS
2.1. Cereal material
Cereal products, corn flour and corn grits were used as secondary reference standards (test samples). Samples were ground according to AOAC Official Method 935.30D and accurately weighed (AOAC 935.30, 2000).
2.2. Chemicals
Petroleum ether, supplied by Merck (Darmstadt, Germany) had all characterristics required by AOAC Official Method 945.16.
2.3. Soxhlet extraction
Adequatly prepared test samples were submitted to extraction on Soxhlet extractor during 2 h, after which extracts were filtered through small, hardened paper into weighed vessels. Vessels containing residue were dried in air during 1 h at 100-105 °C and weighted. The results were reported as percentage (%) of total oil (AOAC 945.16, 2000).
2.4. Supercritical fluid extraction
TFE 2000 Fat Determinator (Leco, St. Joseph, MI, USA) uses supercritical fluid (carbon dioxide) as an extraction solvent. The density and solvent strength of a supercritical fluid can be varied and controlled by regulating pressure and temperature. The use of carbon dioxide as a supercritical fluid makes TFE 2000 superior than conventional methods for fat extraction, since this method has simplified analysis procedure, lower cost per analysis and reduces the environmental hazard. According to manufacturer’s application note for determination of crude fat in corn, the following extraction parameters were set:
- Extraction pressure: 9000 psi
- Extraction temperature: 100 °C
- HVR temperature: 100 °C
- Hold time: 0 minutes
- Extraction time: 45 minutes
- Flow rate: 1.31 pm
2.5. Method verification and estimation of measurement uncertainty
Repeatability, within-laboratory and inter-laboratory precision, detection and quantification limits and method ruggedness were parameters studied during the veryfication of the method. Within day-to-day variations were determined by analyzing corn flour sample in duplicates for several months in order to determine within-laboratory reproducibility and repeatability. The results were expressed as a relative standard deviation.
Inter-laboratory studies provide high-level tests for verifying methods (Garbelotti, Marsiglia, & Torress, 2003). The data from inter-laboratory study, conducted on the corn grits sample, were used for calculation of inter-laboratory precision. The detection and quantification limits were calculated from analysis of blank sample, which was subjected to the same experimental conditions as the test samples. Stability of the method was assessed, by setting warning and action limits during continuous monitoring of control charts.
The measurement uncertainty analysis was estimated according to general principles for calculating measurement uncertainty, outlined in Nordtest Report tr 537 (Magnusson, Näykki, Hovind, & Krysell, 2004).
RESULTS AND DISCUSSION
3.1. Method precision
Precision, expressed as standard deviation (S) and relative standard deviation (RSD) can be divided into: repeatability precision (Sr and RSDr), within laboratory precision (SR and RSDR) and inter-laboratory reproducibility precision. Calculated values can be compared with those of existing methods. If there are no specified requirements for precision parameters in the official method, theoretical relative reproducibility and repeatability standard deviations can be calculated from the Horwitz equation (Taverniers, De Loose, & Van Bockstaele, 2004). The obtained values should not exceed the level calculated by the Horwitz equation:
where C is concentration of analyte in the sample as a decimal fraction.
Since the obtained values for RSDr and RSDR were lower than values calculated using the Horwitz equation, it can be concluded that the tested method has satisfactory precision (Table 1).
Table 1. Repeatability and within laboratory precision
matrix |
Sr (% of oil)
|
SR (% of oil)
|
RSDr(%)
|
RSDR(%)
|
Horwitz (%) RSD
|
|
Corn flour
|
0.03
|
0.04
|
2.08
|
2.83
|
3.76
|
Inter-laboratory precision is the parameter which gives the best approximation of the method accuracy in the case when a standard reference material is not available. It is a fundamental parameter in controlling analytical quality and is usually expressed as a z-score calculated from inter-laboratory comparison study (Taverniers, De Loose, & Van Bockstaele, 2004). The z-score is calculated by dividing the differrence between the laboratory mean and the best estimation of the nominal value by the standard deviation of the method and it represents a performance criterion for participating laboratories (acceptance range is z<|2|). The results of inter-laboratory study, conducted on corn grits sample showed a good laboratory practice, with z-score value of -0.19.
3.2. Detection and quantification limits
Limit of detection (LOD) or detection limit, is the lowest concentration level that can be determined to be statistically different from a blank. It was calculated by multi-plying standard deviation of the blank readings by 3. The limit of quantification (LOQ), which is the lowest concentration of analyte that can be determined quantitatively with an acceptable level of repeatability precision, was determined by multiplying standard deviation of blank samples by 10 (Table 2), (Alves, Casal, & Oliveira, 2009).
Table 2. Values for LOD and LOQ
|
|
LOD%
|
LOQ%
|
|
Blank sample
|
0.006
|
0.02
|
3.2. Quality control
Internal quality control at the chemical laboratory involves a continuous, critical evaluation of methods and working routines in the laboratory. The most important tool in this quality control is the use of control charts. In this way it is possible to demonstrate that the measurement procedure performance is within given limits (Hovind, Magnusson, Krysell, Lund, & Mäkinen, 2007). Control limits – warning (WL) and action (AL) limits determined from analyses of secondary reference standards, in time period of several months, are given in Table 3 and proper X-charts in Figures 1 and 2. WL and AL were calculated as the standard deviation of obtained values of secondary reference standards, multiplied by 2 and 3, respectively (WL=±Sx2; AL=±Sx3).
Table 3. Warning and action limit values for two secondary reference standards
|
|
Corn flour
|
Corn grits
|
|
WL
|
1.43 and 1.60
|
0.52 and 0.66
|
|
AL
|
1.38 and 1.63
|
0.48 and 0.70
|
 Figure 1.
 X-Chart for Corn flour
 Figure 2.
 X-Chart for Corn grits
3.3. Method ruggedness
During verification of the method, ruggedness testing was conducted to ensure possibility of using different equipment for oil extraction in routine laboratory analysis. Corn flour was used as a test sample and total oil content analysis were conduct on both Soxhlet and Total Fat Determinator (TFE2000). Student’s t-test showed that comparable results were obtained between two extractors with t and p values of 1.11 and 0.279, respectively, assuring good congruence between two instruments.
3.4. Estimation of measurement uncertainty
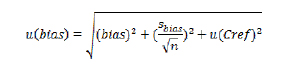
Statistical software Mathcad 2001 Professional (MathSoft, Inc) was used for statistical analysis of the data for estimation of measurement uncertainty. In order to have a representative basis for the uncertainty calculations and to reflect all variations, more than 50 results were used, covering time period of a few months. Standard uncertainty of method bias (u(bias)) was calculated from the results of inter-laboratory study using the following formula (Magnusson, Näykki, Hovind, & Krysell, 2004):
where u(bias) is uncertainty component of bias;
Sbias standard deviation of results obtained from
η number of inter-laboratory comparison studies;
u(Cref) is relative uncertainty component from no-minal value given in the inter-laboratory comparison study report. Bias and corres-ponding standard uncertainties, estimated as relative values, are showed in Table 4.
Table 4. Method bias and standard uncertainty
|
|
Expected value
|
Obtained value
|
Sbias
|
Bias (%)
|
u(bias) (%)
|
|
Corn flour
|
0.97
|
0.91
|
0.14
|
6.19
|
15.6
|
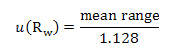
Second uncertainty component was estimated as within-laboratory reproducibility parameter, Rw. Standard uncertainty of this precision parameter was calculated using the following formula (Magnusson, Näykki, Hovind, & Krysell, 2004):
The results, used for calculation of the mean range, are presented in Table 5.
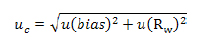
Standard uncertainty estimated from within-laboratory reproducibility was 3.73%. Standard uncertainties were summed by taking the square root of the sum of the squares to give combined standard uncertainty, uc.
The expended uncertainty (U) was calculated using coverage factor k=2 (95% confidence interval):
Table 5. Calculation of the mean range for different cereal products
|
|
x1
|
x2
|
x=(x1+x2)/2
|
d=x1-x2
|
r%=([d]/x)*100
|
|
1
|
1.53
|
1.55
|
1.54
|
-0.02
|
1.48
|
|
2
|
1.56
|
1.54
|
1.55
|
0.01
|
0.92
|
|
3
|
1.56
|
1.57
|
1.57
|
-0.01
|
0.75
|
|
4
|
1.61
|
1.56
|
1.59
|
0.05
|
3.00
|
|
5
|
1.59
|
1.50
|
1.55
|
0.09
|
5.55
|
|
6
|
1.53
|
1.59
|
1.56
|
-0.06
|
3.82
|
|
7
|
1.55
|
1.45
|
1.50
|
0.10
|
6.78
|
|
8
|
1.58
|
1.58
|
1.58
|
0.00
|
0.22
|
|
9
|
1.44
|
1.46
|
1.45
|
-0.02
|
1.24
|
|
10
|
1.47
|
1.46
|
1.46
|
0.02
|
1.33
|
|
11
|
1.49
|
1.47
|
1.48
|
0.02
|
1.65
|
|
12
|
1.46
|
1.41
|
1.43
|
0.04
|
2.91
|
|
13
|
1.49
|
1.47
|
1.48
|
0.02
|
1.59
|
|
14
|
1.48
|
1.52
|
1.50
|
-0.04
|
2.92
|
|
15
|
1.50
|
1.50
|
1.50
|
0.00
|
0.22
|
|
16
|
1.48
|
1.45
|
1.46
|
0.02
|
1.55
|
|
17
|
1.50
|
1.52
|
1.51
|
-0.02
|
1.46
|
|
18
|
1.46
|
1.51
|
1.49
|
-0.05
|
3.15
|
|
19
|
1.51
|
1.52
|
1.51
|
-0.02
|
1.04
|
|
20
|
1.44
|
1.52
|
1.48
|
-0.08
|
5.50
|
|
21
|
1.46
|
1.53
|
1.49
|
-0.07
|
4.61
|
|
22
|
1.53
|
1.54
|
1.53
|
-0.01
|
0.97
|
|
23
|
1.51
|
1.54
|
1.53
|
-0.03
|
2.11
|
|
24
|
1.52
|
1.52
|
1.52
|
0.00
|
0.04
|
|
25
|
1.54
|
1.48
|
1.51
|
0.06
|
4.18
|
|
26
|
1.51
|
1.45
|
1.48
|
0.06
|
3.97
|
|
27
|
1.58
|
1.53
|
1.55
|
0.06
|
3.64
|
|
28
|
1.55
|
1.50
|
1.53
|
0.05
|
3.02
|
|
29
|
1.52
|
1.45
|
1.49
|
0.07
|
4.51
|
|
30
|
1.52
|
1.52
|
1.52
|
0.00
|
0.27
|
|
31
|
1.51
|
1.50
|
1.51
|
0.02
|
1.06
|
|
32
|
1.53
|
1.53
|
1.53
|
0.00
|
0.02
|
|
33
|
0.59
|
0.62
|
0.61
|
-0.03
|
5.25
|
|
34
|
0.62
|
0.60
|
0.61
|
0.02
|
3.68
|
|
35
|
0.66
|
0.61
|
0.63
|
0.05
|
8.04
|
|
36
|
0.62
|
0.63
|
0.63
|
-0.01
|
0.94
|
|
37
|
0.62
|
0.63
|
0.62
|
-0.01
|
1.44
|
|
38
|
0.65
|
0.60
|
0.62
|
0.05
|
8.15
|
|
39
|
0.61
|
0.63
|
0.62
|
-0.02
|
3.34
|
|
40
|
0.65
|
0.64
|
0.65
|
0.01
|
1.19
|
|
41
|
0.53
|
0.54
|
0.53
|
-0.01
|
1.13
|
|
42
|
0.57
|
0.62
|
0.59
|
-0.05
|
8.12
|
|
43
|
0.61
|
0.57
|
0.59
|
0.04
|
7.21
|
|
44
|
0.61
|
0.57
|
0.59
|
0.04
|
6.80
|
|
45
|
0.51
|
0.54
|
0.53
|
-0.03
|
6.17
|
|
46
|
0.61
|
0.58
|
0.59
|
0.03
|
5.09
|
|
47
|
0.56
|
0.63
|
0.59
|
-0.07
|
11.3
|
|
48
|
0.58
|
0.59
|
0.58
|
-0.01
|
1.98
|
|
49
|
0.58
|
0.60
|
0.59
|
-0.02
|
2.57
|
|
50
|
0.61
|
0.60
|
0.60
|
0.01
|
1.54
|
|
51
|
0.54
|
0.60
|
0.57
|
-0.07
|
11.4
|
|
52
|
0.53
|
0.57
|
0.55
|
-0.03
|
5.93
|
|
53
|
0.51
|
0.62
|
0.57
|
-0.10
|
18.4
|
|
54
|
0.56
|
0.57
|
0.56
|
-0.01
|
1.34
|
|
55
|
0.59
|
0.60
|
0.60
|
-0.01
|
1.52
|
|
56
|
0.55
|
0.62
|
0.59
|
-0.06
|
11.0
|
|
mean range (%) 3.73
|
CONCLUSION
Different parameters were examined during the verification study of the method for determination of total oil content in cereal products. Precision parameters gave satisfactory values, showing a good method repeatability and reproducibility. By determining warning and action limits it was possible to monitor stability of the testing method over a long period of time. Method ruggedness test showed a good matching between two different instruments and techniques for the required analysis, which is important factor in routine laboratory practice. In the examined food matrices, statistically estimated measurement uncertainty gave a satisfactory value for the given confidence interval of 95%. Based on obtained results, it can be concluded that the examined method can be successfully used for determination of total oil content in cereal based food products.
Download full article PDF
 DOWNLOAD PDF