DETERMINATION OF WORKING ACCURACY AS AN IMPORTANT STEP FOR IMPLEMENTATION OF CORRECTIVE MEASURES IN FEED PLANT
DOI:
UDK:
JOURNAL No:
Volume 37, Issue 1
PAGES
7-12
KEYWORDS
working accuracy, mixing homogeneity, tracers, corrective measures
Đuro Vukmirović*1, Olivera Đuragić1, Slavica Sredanović1, Jovanka Lević1, Radmilo Čolović1, Dušica Ivanov1, Bojana Kokić1
1Institute for Food Technology, University of Novi Sad, Bul. cara Lazara 1, Novi Sad, Serbia
ABSTRACT
ABSTRACT
Determination of working accuracy of feed plant provides useful information about critical points in production process. This enables implementation of corrective measures towards minimizing of contamination risk which is especially important for single-line plants in order to prevent contamination of non-targeted feed with medications from previous batches. In this investigation, working accuracy of two feed plants was tested. By observing the results it was concluded that in the first plant corrections must be made in mixing process, because even the longest mixing time (10 min) didn’t provide homogeneous mixture. On the other hand, carry over level for the longest mixing time was very small. In the second plant, results for mixing homogeneity were good for all three mixing times, but level of carry over was extremely high in the first rinsing batch. It can be concluded that first plant is not capable of producing and maintaining homogeneous mixture with existing equipment and the first step would be reconstruction of the mixer. In the second plant reconstruction of conveying system and implementation of rinsing batches is absolutely necessary.
INTRODUCTION
Mixing is one of the most essential and critical operations in the process of feed manufacturing. The objective of mixing is to create a completely homogeneous blend. In other words, every sample taken should be identical in nutrient content (Herrman and Behnke, 1994). In order to test the quality of mixed material, a small quantity of indicator (coloring materials, salts etc.) can be added. On the completion of mixing process, a number of samples are taken from the mixer, and the proportion of indicator is checked. The resulting mixture quality is designated with variation coefficient which indicates the standard deviation, as a percentage of the average value. The smaller these values are, the mixture is better (Kersten et al., 2005).
Another problem in feed plants is carry over. Carry over is defined as the contamination of the material or a product with another material or product that originates from previous use of equipment. Carry over occurs in mixers due to incomplete emptying between different batches of feed. Regular inspection and cleaning of the mixers are required to prevent buildup of residues inside the mixer (Ratcliff, J., 2009). Carry over also can occur in other parts of the plant due to: faults in plant layout, formation of residues and dead zones, etc. (Feil, A., 2006).
Feed millers must recognize their responsibility to provide quality products to their customers and they should provide consistent quality products by implementing sound quality control procedures (Đuragić et al., 2007). In accordance with the feed legislation, the proof of the socalled working accuracy of the production plant is the key point of quality assurance by process quality in feed mills. The working accuracy of the production plant includes three components, which have to be determined experimentally (Heidenreich E., 1998):
-
The real concentration of the considered additive in the compound feed after the usual mixing time and after conveying the mixture to the final station (e.g., silo for delivery) in comparison to the nominal concentration value.
-
The homogeneity of the mixture after usual mixing time and after conveying the mixture to the final station expressed by the coefficient of variation in each case.
-
The cross contamination of the rinsing batch by the considered additive, produced without this additive after two test batches.
Experimental determination of working accuracy of feed plant cannot be carried out by means of real additives because of high dispersion of the analytical results for most of the used additives. It is impossible to measure homogeneity of additive distribution if dispersion of the analytical results for the concentration of the additive is higher than variation of its concentration in the mixture. Thus indicator substances (tracers) are in use instead of additives. Indicator substance simulates behavior of additive so it has to have similar particle size distribution and density (Heidenreich E., 1997).
Different substances including amino acids, microminerals, salt (NaCl), and drugs have been used as tracers to measure feed mixing efficiency. For many years, the colored iron tracer particles which can be separated from the formula feeds magnetically, have been successfully used in practice (Barashkov, N., 2008).
MATERIALS AND METHODS
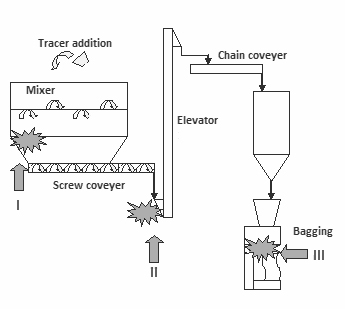
Technological scheme (Picture 1) of the examined feed plants is the same but the equipment is different: different type of mixer, different construction of conveyers, etc. There were three control points: in the mixer (control point 1), after screw conveyer (control point 2) and at bagging (control point 3). The control points were determined in accordance with the risk assessment.
Homogeneity was determined by Micro-tracer® method (Micro Tracers, Inc., San Francisco, CA 94124). F tracers (colored iron grit, 25 000 particles per gram) have been added to the mix in mixing ratio 1:10.000 (100 g/t) which results in 250 particles per sample, with the sample size of 100 grams.
In the first plant, three mixing times were tested. Microtracer Blue® was added at the beginning of the mixing, after 3 minutes Microtracer Green® was added, two minutes later, Microtracer Red® and after 5 minutes mixer was stopped. Thus mixing times of 5, 7 and 10 minutes were tested. Ten samples have been taken directly from the mixer, after screw conveyer and at bagging scale. Sizes of the samples were about 100-150 g, and after analyzing of samples all values were recalculated on 100 g sample.
Also in the second plant, three mixing times were tested in the same manner as in the first plant using three colors of tracers (red, blue and orange) for three mixing times (250, 360 and 480 s). Eighteen samples for each mixing time have been taken.
Tracers were isolated by magnetic separation using a “Rotary detector” (Micro Tracers, Inc., San Francisco, CA 94124) equipped with a special magnet. After isolating from the compound feed, tracers were demagnetized, sprinkled onto a large filter paper, sprayed with a mist of 50% ethanol, the paper was dried and the resulting colored spots counted. Data were calculated by statistical programme to determine mixing homogeneity. Results were interpreted utilizing Poisson Statistics and related chisquared calculations where value of PROBABILITY was criteria for homogeneity, and P < 1% means that mixture is not homogenous, for P > 5% mixture is homogenous and in range between 1 and 5% conclusion about homogeneity cannot be drawn.
Determination of carry-over was carried out in two rinsing batches of feed manufactured after the batch containing the tracer in both plants. Ten samples (each of about 200 g)
were taken at each control point. Tracers were isolated from the feed material in the same manner as for mixing homogeneity determination. Results of carry-over were recorded as a number of colored iron particles in each sample and recalculated on 200 g sample. The carry-over was calculated as a percentage of the concentration in the 1st and 2nd batch manufactured without tracer, divided by the concentration of the tracer in the last batch containing the tracer.
were taken at each control point. Tracers were isolated from the feed material in the same manner as for mixing homogeneity determination. Results of carry-over were recorded as a number of colored iron particles in each sample and recalculated on 200 g sample. The carry-over was calculated as a percentage of the concentration in the 1st and 2nd batch manufactured without tracer, divided by the concentration of the tracer in the last batch containing the tracer.
RESULTS AND DISCUSSION
In the first plant, homogeneity results in the first control point (mixer) (Tab. 1) are showing that homogeneity in the mixer wasn’t achieved (P < 5%) and that for mixing times of 5 and 7 minutes indicator wasn’t spread through all mixing chamber, because there are samples with uncountable number of particles and samples without particles. When mixing time was 10 minutes, indicator was spread through all mixing chamber but mixture wasn’t homogeneous. These results indicate that mixer doesn’t work properly.
Table 1. Homogeneity in the mixer in the first feed plant
|
Mixing time
|
|||
|
5 min
|
7 min
|
10 min
|
|
|
Number of particles per 100 g
|
|||
|
Tracer
|
F red
|
F green
|
F blue
|
|
|
|||
|
Sample 1
|
1595
|
1766
|
233
|
|
Sample 2
|
12
|
13
|
305
|
|
Sample 3
|
1
|
1
|
268
|
|
Sample 4
|
7
|
1
|
260
|
|
Sample 5
|
impossible
to count
|
impossible
to count
|
225
|
|
Sample 6
|
3
|
4
|
283
|
|
Sample 7
|
0
|
0
|
266
|
|
Sample 8
|
0
|
0
|
246
|
|
Sample 9
|
0
|
0
|
221
|
|
Sample 10
|
0
|
0
|
247
|
|
P (%)
|
0
|
0
|
0.18
|
As it can be expected, mixture also wasn’t homogeneous after screw conveyer and at bagging (Tab 2). The first samples taken after screw didn’t contain tracer particles, which indicates presence of death zones in the bottom of the mixer where there is no mixing action.
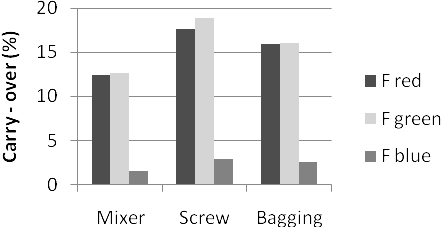
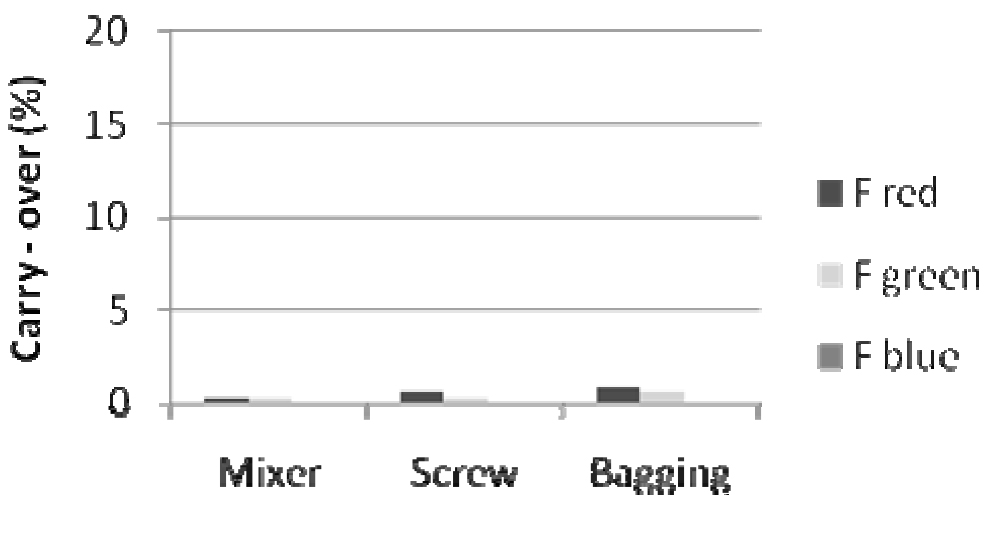
For the mixing time of 10 minutes, level of carry-over is under 4% in all three control points, but for other mixing times is much higher, with the highest level in the screw conveyer. In the 2nd rinsing batch, level of carry-over was very low (0% for 10 minutes mixing time).
Table 2. Homogeneity after screw conveyer and at bagging in the first feed plant
|
After screw conveyer
|
At bagging
|
|||||
|
Number of particles per 100 g
|
||||||
|
Tracer
|
F red
|
F green
|
F blue
|
F red
|
F green
|
F blue
|
|
|
||||||
|
Sample 1
|
0
|
0
|
0
|
1
|
0
|
0
|
|
Sample 2
|
0
|
0
|
0
|
272
|
0
|
235
|
|
Sample 3
|
0
|
0
|
223
|
205
|
0
|
231
|
|
Sample 4
|
0
|
0
|
236
|
89
|
0
|
100
|
|
Sample 5
|
489
|
524
|
212
|
123
|
489
|
198
|
|
Sample 6
|
217
|
177
|
183
|
142
|
217
|
167
|
|
Sample 7
|
366
|
421
|
118
|
249
|
366
|
212
|
|
Sample 8
|
393
|
301
|
228
|
180
|
393
|
171
|
|
Sample 9
|
354
|
306
|
222
|
290
|
354
|
209
|
|
Sample 10
|
483
|
358
|
222
|
261
|
483
|
198
|
|
P (%)
|
0
|
0
|
0
|
0
|
0
|
0
|
rinsing batch are presented on the Picture 2 and Picture 3.
Table 3. Homogeneity in the mixer in the second feed plant
|
|
Mixing time
|
||
|
250 s
|
360 s
|
480 s
|
|
|
Number of particles per 100 g
|
|||
|
Tracer
|
F red
|
F blue
|
F orange
|
|
Sample 1
|
232
|
285
|
291
|
|
Sample 2
|
225
|
265
|
285
|
|
Sample 3
|
241
|
291
|
268
|
|
Sample 4
|
244
|
257
|
302
|
|
Sample 5
|
262
|
313
|
307
|
|
Sample 6
|
279
|
252
|
277
|
|
Sample 7
|
239
|
294
|
286
|
|
Sample 8
|
267
|
266
|
271
|
|
Sample 9
|
290
|
297
|
324
|
|
Sample 10
|
270
|
282
|
267
|
|
Sample 11
|
279
|
304
|
314
|
|
Sample 12
|
269
|
254
|
265
|
|
Sample 13
|
249
|
266
|
277
|
|
Sample 14
|
283
|
258
|
322
|
|
Sample 15
|
250
|
257
|
295
|
|
Sample 16
|
245
|
285
|
268
|
|
Sample 17
|
252
|
288
|
312
|
|
Sample 18
|
239
|
275
|
-
|
|
P (%)
|
8.82
|
16.93
|
14.15
|
In the second plant mixer was bigger and more samples have been taken in order to cover whole mixer volume (Tab. 3).
From obtained probability values, it can be seen that for all three mixing times mixture was homogeneous and mixing time of 360 s was recommended because Pvalue was the largest.
In the second plant, carry-over was determined only for mixing time 360 s (Picture 4).
It can be seen that in the 1st batch carry-over was very high and that in the 2nd batch it is strongly reduced but not eliminated. Thus one more rinsing batch is necessary in order to clean the production line. These results show than cleaning of the production line is necessary after every batch, especially when batch with medication has been produced.
CONCLUSION
For the first plant it can be concluded:
-
With existing equipment is not possible to produce homogeneous mixture and maintain homogeneity to the final station. Mixer doesn’t work properly and possible solution could be reconstruction of the mixer. After that, mixer should be checked again.
-
Improving mixing homogeneity in the mixer reduces level of carry over in all three points.
In the second plant:
-
Mixer is capable of producing homogeneous mixture and recommended mixing time is 360 s.
-
Reconstruction is necessary for conveying system in order to reduce leftovers and carryover level. After reconstruction, carryover analysis should be repeated.
-
In any case, introduction of flushing batch is necessary.
Acknowledgements
This paper is a result of the research within the project 046012 “Istraživanje savremenih biotehnoloških postupaka u proizvodnji hrane za životinje u cilju povećanja konkurentnosti, kvaliteta i bezbednosti hrane za životinje (Study of modern biotechnological methods in the production of animal feed in order to increase competitiveness, quality and safety of the feed)”, financed by Ministry of Science and Technological Development, Republic of Serbia.


