UTILIZATION OF DYNAMIC OSCILLATORY MEASUREMENTS FOR AGAR THRESHOLD GEL CONCENTRATION AND GEL STRENGTH DETERMINATION
DOI:
UDK:
JOURNAL No:
Volume 36, Issue 3-4
PAGES
69-74
KEYWORDS
agar, threshold gel concentration, gel strength, rheology, texture
Tamara R. Dapčević Hadnađev1*, Miroslav S. Hadnađev1, Aleksandra M. Torbica1
1Institute for Food Technology, University of Novi Sad, Bul. cara Lazara 1, Novi Sad, Serbia
ABSTRACT
ABSTRACT
In this paper the development of a method for rheological determination of threshold gel concentration and quantification of gel strength of agar is shown. The threshold gel concentration was determined by performing frequency sweep tests at different agar concentrations (0.05%, 0.1%, 0.15%, etc.). The values of threshold gel concentration (concentration after which crossover between storage and loss modulus was observed) were not higher than 0.25%. Gel strength was expressed as the value of the storage modulus (G'). The results obtained using frequency sweep tests were in a good agreement with the results obtained by standard test for threshold gel concentration determination and the results of gel strength measured by Texture Analyser. Therefore, it can be concluded that dynamic oscillatory measurements can successfully replace other tests for agar characterization. The special advantage of this test is that in one test it is possible to obtain the results of different parameters such as threshold gel concentration, gel strength and viscoelastic properties of agar.
INTRODUCTION
Agar is hydrophilic polysaccharide extracted from red macroalgae of the class Rhodophyceae, families Gracilariaceae and Gelidiaceae (Armisen & Galactas, 1987). It was the first phycocolloid used as a food additive in our civilization (Armisen, et al., 2000). Nowadays, due to its gelforming properties, agar is widely used in pharmaceutical, cosmetics and food industry. As a food additive, agar is considered in the US as GRAS (Generally Recognized as Safe) by the FDA (Food and Drug Administration). In Europe it is considered an E406 additive. The structure of agar consists of repeating agarobiose units alternating between 3-linked β-D-galactopyra-nosyl and 4-linked 3,6-anhydro-α-L-gala-ctopyranosyl units (Araki, 1966).
Agar can be fractionated into two components which content depend on the species, environmental conditions, physiological factors and the manufacturing process employed (Armisen, et al., 2000; Praiboon et al., 2006). Agarose is the fraction of agar that essentially gels and it is a neutral polysaccharide (Labropoulos et al., 2002). It has high molecular weight, above 100,000 Daltons as well as low sulfate content usually below 0.15% (Armisen, et al., 2000). The rest of the fraction is termed agaropectin and contains all the charged polysaccharide components (Labropoulos et al., 2002). It has a lower molecular weight, usually below 20,000 Daltons. However, sulfates are in much higher content being 5% to 8% (Armisen, et al., 2000).
Agarose produces "physical gels" which means that polymer molecules form the structure solely by hydrogen bonds. The most remarkable property of "physical gels" is their reversibility. On contrary, "chemical gels" such as polyacrylamides which have their molecules joined by covalent bonds are irreversible (Armisen, et al., 2000).
The yield, physical and chemical properties of agar determine its value to the industry (Marinho-Soriano, 2001). Among the physical properties the most important are gel strength and threshold gel concentration. Since agar is one of the most expensive ingredients, food and pharmaceutical Industries are seeking for agars which can produce stronger gel strength in lesser proportions.
Threshold gel concentration is commonly determined using the FAO method (FAO method, 2006). According to FAO method the threshold concentration of the sample is the lowest concentration of gel that resists gravity without rupture. The method is easy to perform and its cost saving. However, it does not differ between agars of different gel strength, elasticity, etc. In order to determine gel strength one have to employ Nikansui gel tester (FAO report, 1996), which is widely distributed among Chinese agar manufacturers, but not very common in Europe, America, etc. The other way to measure the gel strength is to use some other types of instruments such as penetrometre or texturometer. However, there is no standard method for agar gel strength determination; such there is for gelatin.
Therefore, the objective of this study was to establish the rheological method which will provide the results of threshold gel concentration, gel strength and viscoelastic properties of agar in one test.
Rheology is considered the most complete technique of characterization of polymer systems (Kakadjian et al., 1999). Due to their viscoelastic behaviour gels are best characterized in terms of their mechanical response to oscillatory shear under small deformation (Aguilera & Stanley, 1999). The frequency sweep is probably the most common mode of oscillatory testing because it shows how the viscous and elastic behaviour of the material changes with the rate of application of strain and stress (frequency) while the amplitude of the input signal (stress or strain) is held constant. Therefore, frequency sweeps are very useful in comparing, sometimes called "finger printing", different food products or in comparing the effects of various ingredients and processing treatments on viscoelasticity (Steffe, 1996).
The elastic response of the frequency sweep technique is represented by G' which represents the storage modulus or the stress energy temporarily stored in a cycle of deformation. The loss or viscous modulus G'' represents the stress energy used to initiate flow and is proportional to the average dissipation of energy. The shift angle or loss tangent (tanδ) is the ratio of the energy lost to that stored during a single cycle of deformation, thus representing the ratio of viscous/elastic properties (Kakadjian et al., 1999; Tanaka et al., 2003).
In this paper, the results for threshold gel concentration obtained by FAO method and those for gel strength determined with Texture Analyser were compared to the results of rheological frequency sweep test.
MATERIALS AND METHODS
Materials
In this study, agars from different producers, referred to as agar1, agar2 and agar3 were used.
Determination of threshold gel concen-tration
For threshold gel concentration determination serial dilutions of the sample with known solids content (0.05%, 0.1%, 0.15%, 0.20%, 0.25%, etc.) were prepared and placed in tubes, 150 mm long by 16 mm internal diameter, stoppered at both ends. The samples were cool for 1 h at 20-25 °C. Consequently, cylinders of gel were allowed to slide from the tubes to a level surface. The lowest concentration of gel that resists gravity without rupture for 5-30 s was the threshold concentration of the sample (FAO method, 2006).
Determination of gel strength by Texture Analyser
The gel strength (g cm−2) was measured using a Texture Analyser (TA-XT2, Stable Micro Systems). The measurements were performed on a 1.5% w/w agar solution which was prepared by heating agar-deionized water suspension to 90 °C, under constant stirring, until it was dissolved completely. The samples were left at room temperature for 1h. Subsequently, the formed gels were kept at 20 °C for 24 hours. The gel strength measurements were performed using a cylindrical plunger P/0.5R, operating at test speed of 0.5 mm s-1, rupture distance 8 mm. The mean strength of the two or three samples was taken as the gel strength.
Rheological determination of threshold gel concentration and gel strength
Rheological properties of agar solutions and gels prepared for threshold gel concentration and gel strength determination were measured at 20 °C using a HAAKE Mars rheometer (Thermo Scientific, Karlsruhe, Germany) equipped with a serrated parallel plate geometry sensor (35 mm diameter and 1 mm gap) to avoid gel slippage during measurements. Prior to frequency sweep test, stress sweep tests at a fixed frequency of 1 Hz were conducted to choose common viscoelastic range for all systems. Subsequently, a dynamic frequency sweep was conducted by applying a constant stress of 0.05 Pa (and 10 Pa for concentrated 1.5% agar gel) which was within the linear region, over a frequency range between 1 and 10 Hz. All measurements were performed in duplicate and the mean values were reported.
RESULTS AND DISCUSSION
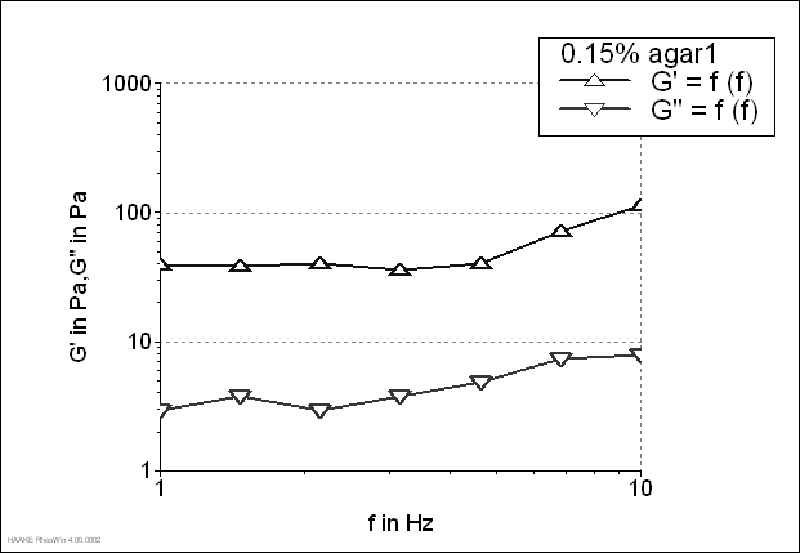
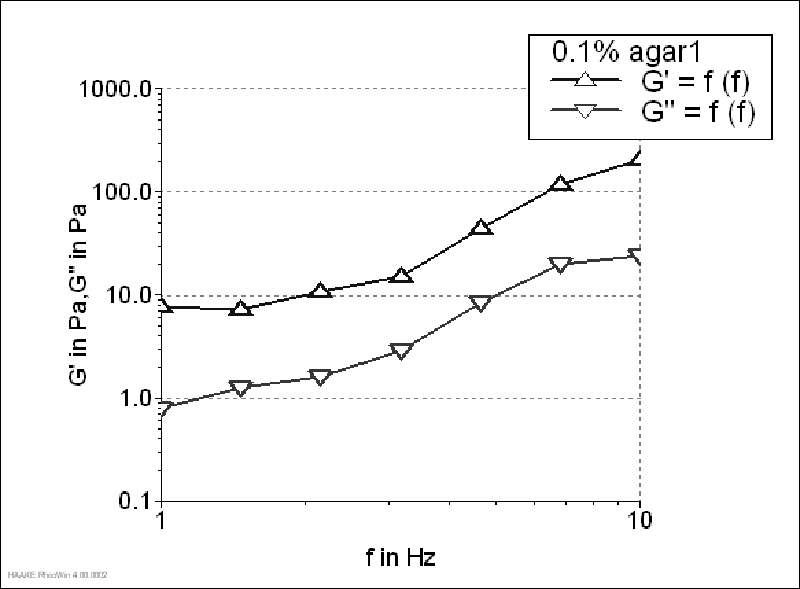
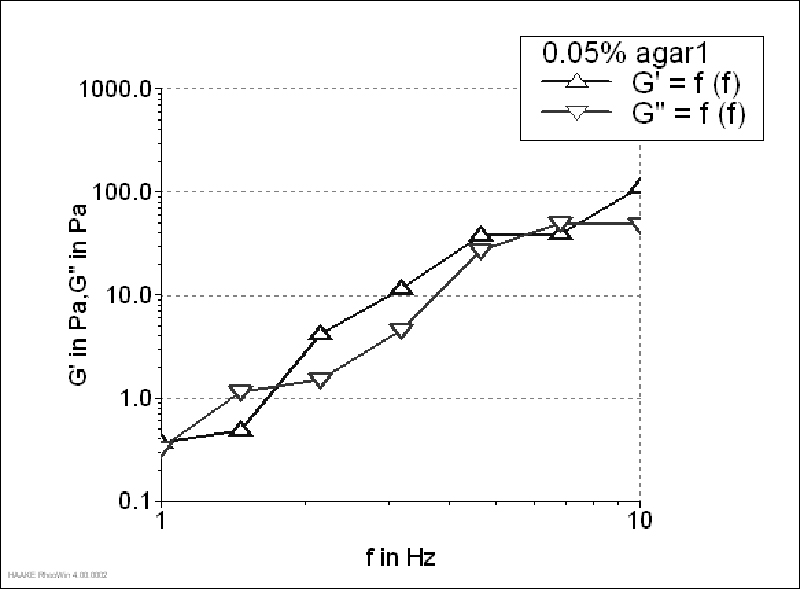
The changes in storage (G') and loss (G") moduli with frequency for agar1 gels of different concentrations are presented in Figure 1-4. That way the changes of G' andG" as the gel structure develops was shown. According to the magnitude of G'/G"ratio, it is possible to evaluate the behaviour of the system (Clark & Ross-Murphy, 1987). System having G'/G"ratio lower than 1, behaves as concentrated solution; the one having G'/G"higher than 1 and lower than 10 can be characterized as a material with weak gellike behaviour; while the one with G'/G"higher than 10 behaves as a strong gel.
The storage modulus of 1.5% agar gel (Figure 1) was much higher than the loss modulus, which is typical of strong gels. It was characterized by the G'/G"value of 23.10 (determined at 1 Hz). Although, G' value of 0.15 and 0.1% agar gels was also higher than G", both moduli increased with increasing frequency, which was more pronounced for 0.1% gel (Figure 2-3). Agar gels in the concentration of 0.15 and 0.1% had G'/G"values of 13.32 and 9.73 (determined at 1 Hz), respectively. Since the ratio G'/G"was higher than 1 and lower than 10, 0.1% gel could be characterized as a material with weak gellike behaviour. On contrary, for 0.05% gels a crossover between two moduli was observed throughout the tested frequency range, meaning that at some frequencies the magnitude of G" was greater than that of G', which is typical concentrated solution behaviour (Figure 4). That way, according to the given rheograms it can be concluded that 0.1% agar solutions was the threshold gel concentration.
The threshold gel concentrations of other agar solutions determined by oscillatory frequency sweep test and FAO method are summarized in Table 1. Solutions of agar1 and agar2 had the same threshold gel concentrations which were lower than agar3 threshold gel concentration, meaning that agar1 and agar2 are more economically suitable. From the results presented in Table 1 it can be concluded that using the rheological method, the same results can be obtained as with FAO method.
The results of gel strength determined by Texture Analyser and frequency sweep rheological test are given in Table 2. Gel strength measured by rheological method was expressed as the value of storage modulus (G'), as it is a common practice among polymer rheology researchers (Fretheim et al., 1986;Duggan & Waghorne, 2001).
Table 1. Threshold gel concentration of different agars determined by FAO method and dynamic oscillatory (frequency sweep) test
Threshold gel concentration (%) |
Agar1 |
Agar2 |
Agar3 |
|
FAO method |
0.1 |
0.1 |
0.15 |
|
Dynamic oscillatory test |
0.1 |
0.1 |
0.15 |
Table 2. Gel strength of different agars determined by textural and dynamic oscillatory (frequency sweep) measurements
Gel strength |
Agar1 |
Agar2 |
Agar3 |
|
Textural measurements (g s-2) |
1486 |
1970 |
1732 |
|
Dynamic oscillatory test, G' (Pa) |
14030 |
18961 |
14906 |
Since G' did not change with frequency, it was determined as the mean of the values that were within the given frequency range. The same increase in gel strength, following the order: agar1 < agar3 < agar2, was noted using both methods. However, in contrast to textural measurements, dynamic rheological measurements were able to determine low gel strengths, as it was shown in Figure 2 and 3, and reported by Draget et al. (1993). Namely, Draget et al. (1993) who have compared three different gel strength tests have concluded that only dynamic measurements were suitable for quantifying low gel strengths.
CONCLUSIONS
According to the obtained results it can be concluded that rheological frequency sweep test can be successfully used to characterize agar gels, quantify their strength and to determine the minimum concentration required for gel formation. Therefore, in a single test it is possible to measure different parameters and thus to replace other common methods for agar characterization. In this paper agar solutions and gels for rheological measurements were prepared following the different procedures. The first procedure was the one for threshold gel concentration determination, where low gel strength agars were prepared and the second one, which was used for gel strength measurements, was the one which required strong gels preparation. However, since it was proven that dynamic oscillatory measurements can be used for quantifying low gel strengths, in order to minimize the test duration; gel strength can be measured using the gels prepared for threshold concentration determination.
ACKNOWLEDGEMENTS
This work was financially supported by Ministry of Science and Technological Development, Republic of Serbia (project no. 20066).

 JOURNAL TOOLS


 INSTITUTE